Most of us have heard about the 80/20 rule a.k.a. The Pareto Principle. Simply put: 80% of something have just 20% of the reasons. In other words if you address the 20% of the causes, 80% of the symptoms will go away because of that.
Since we do a lot of performance optimization for Drupal sites, we noticed a while back that this rule is true for optimization: there will be a few underlying causes that account for the bulk of the symptoms, whether they are slowness, inability to handle many concurrent users, or poor server resource utilization.
No Measurements
One such case is for a client that we are working with currently. They get over 415,000 page views per day and 100,000 visits (both via Google Analytics). They did not have any other server resource measurement tools, nor web server log analysis tools.
So in addition to our Drupal performance assessment, tuning and optimization service, we recommended that we also do Drupal server installtion, configuration and tuning for them. They accepted and we proceeded to configure the new server with an optimized stack at the same hosting company they were using.
Performance Improvements
After we installed our recommended set of software tools, we found that Awstats says that page views are as much as 950,000 per day. We have not seen such high variance from Google Analytics before. Normally that variance is around 20% more for Awstats over Analytics.
We did the normal tuning tasks that we do for clients, including configuring memcched for Drupal, running PHP as fcgid with Apache and installing an PHP op-code cache/accelerator.
Those tasks helped a lot and we were able to get better stability and performance on a single server.
Performance Variance
But there was still some variance that we are seeing in the server resource utilization, such as load average occasionally jumping up, and disk I/O as well.
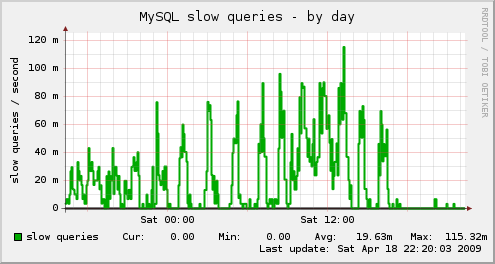
After some investigation, we narrowed down the main reason to MySQL doing a lot of slow queries that use temporary tables and file sort. We saw that on Munin's graph under MySQL slow queries as well as in the I/O stat graph as well.
The query in question was a voting API "Current user" view, which causes this query which takes 6 to 14 seconds:
SELECT node.nid AS nid,
   node.title AS node_title,
   votingapi_vote_node_vote_curuser.value_type AS votingapi_vote_node_vote_curuser_value_type,
   votingapi_vote_node_vote_curuser.value AS votingapi_vote_node_vote_curuser_value,
   votingapi_vote_node_vote_curuser.timestamp AS votingapi_vote_node_vote_curuser_timestamp
 FROM node node
 LEFT JOIN votingapi_vote votingapi_vote_node_vote_curuser
   ON node.nid = votingapi_vote_node_vote_curuser.content_id
   AND (votingapi_vote_node_vote_curuser.content_type = 'node'
   AND votingapi_vote_node_vote_curuser.tag = 'vote'
   AND votingapi_vote_node_vote_curuser.uid = '0')
 WHERE (node.status <> 0)
 AND (votingapi_vote_node_vote_curuser.value IS NOT NULL)
   ORDER BY votingapi_vote_node_vote_curuser_timestamp DESC
 LIMIT 231300, 50;
An EXPLAIN on that statement showed "using temporary, using filesort", so no wonder it was really slow.
As soon as we disabled that view, things were far more stable, and it shows ...
Major Improvement
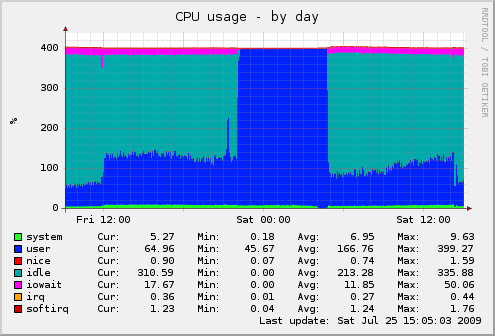
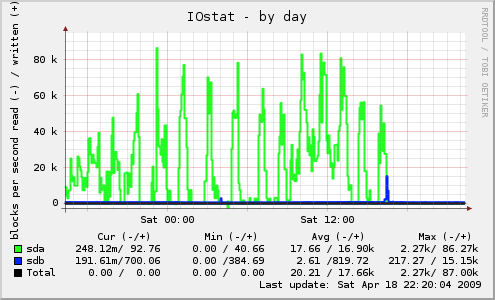
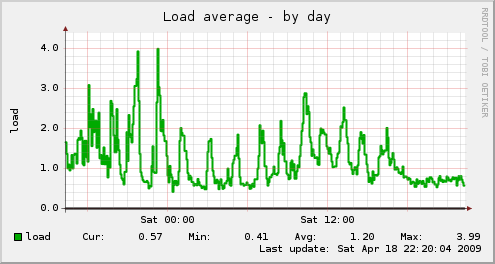
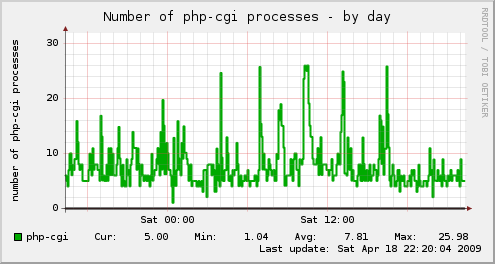
Look at 5 pm in the following graphs, and compare before and after.
MySQL slow queries drop sharply.
See how the CPU graph shows barely any system time (green) after 5pm, and less I/O wait time (magenta)?
The I/O stat graph shows barely any activity after the change on /dev/sda (the root disk, which has the /tmp directory that MySQL uses for temporary tables).
The load average falls visibily as a result.
And the PHP CGI processes show much less variance.
Conclusion
In many cases of slow performance, there are "low hanging fruit" that would give measurable performance enhancement for relatively little effort. The hard part is finding which are the ones that apply to your specific site, and addressing them. This is why we recommend starting with a performance assessment.


Comments
Visitor (not verified)
I'm always surprised when
Sun, 2009/04/19 - 08:53I'm always surprised when someone mentions he has performance problems but has no data to show, because there is no monitoring at place. I couldn't sleep at all with no monitoring on my machine..
Did you find out where the variance in page impressions came from? Search engine bot traffic alone can't explain that, can it?
Khalid
Importance of data for analysis
Sun, 2009/04/19 - 10:17Yes, we need data first. General questions of "why my site is slow" or "can Drupal handle X number of users" are too vague and can't be answered in a generic way, specially when there is no data to draw from.
The variance of awstats vs. Google Analytics is still under investigation for that site. For another site, the 20% was basically search engine crawlers, bots, feeds, ...etc. For this site we turned Apache logging off temporarily to see if the slow query was the sole culprit for high disk I/O wait (and it was indeed that). So we turned Apache logs back on.
One thing we noticed is that the default configuration for awstats has DNSLookup set to 1, and since we invoke it every 10 minutes, it may be that other instances were processing the same data over and over. We disabled DNSLookup, and will see after a couple of days if it was that causing records from the access log to be processed more than once, whether there is still variance, or something else.
Khalid
Google Analytics vs. Awstats
Mon, 2009/04/20 - 13:14We found the reason for the variance between Google Analytics and Awstats. Initially we had 415,000 in GA vs. 950,000 in Awstats. After some investigation it turns out that they have .xml files that get loaded from a flash applicaiton. Awstats was not set to consider xml as a "not a page". So adding those to the following line in the awstats configuration did the trick.
The figures from both applications are much closer now.
Visitor (not verified)
great advice, Khalid
Sun, 2009/04/19 - 10:22This is great advice - nice article.
One question, were they using the latest version of VotingAPI? There were some index tweaks made to the moduel recently as a result of it's use on a large site: http://drupal.org/node/372393
Perhaps those could help to keep the block and improve performance.
Khalid
Not the latest
Sun, 2009/04/19 - 10:29They are using 6.x-2.0-rc1, which does not have this fix. But the query in the issue is different. It is a query by key, with no joins at all, so will definitely benefit from the new index.
2bits will be upgrading them to the latest version of several modules. Not sure if we will go with a plain -dev though.
Thanks for the pointer.
Visitor (not verified)
Added to DrupalSightings.com
Mon, 2009/04/20 - 06:36Added to DrupalSightings.com