We discussed the topic of the open buffet binge syndrome, where web sites "gorge" on contributed modules, and cause site performance to be slow and memory utilization to be high.
We encountered an interesting case recently while doing work for a client. The main symptom was page execution time that is high (800 to 1200 ms), but database query time that is low.
The normal case is where the total page execution time is high, and
a significant portion of that is due to database queries. Using the
devel module we can identify those and work on tuning the module, or
the database to squeeze more performance.
In this case, it was the other way around. For example:
Executed 175 queries in 43.46 milliseconds. Page execution time was 1150.73 ms.
Why would queries take only 43 ms, yet the whole page execution is 1150 ms? Where are the 1107 ms spent? This is too high.
So, in order to troubleshoot this we replicated the site to our test servers, and proceeded to investigate. Our test server runs APC, so PHP time should not be high at all.
Using xdebug and kcachegrind, we narrowed down the problem to the drupal_load() function, where most of the time was spent.
Seeing that this function does include_once() for every module, that was the place to investigate.
Measuring include_once
First we changed the drupal_load() function to look like this:
function drupal_load($type, $name) {
static $files = array(), $total_time = 0;
if (isset($files[$type][$name])) {
return TRUE;
}
$timer_id = 'include ' . $name;
timer_start($timer_id);
$filename = drupal_get_filename($type, $name);
if ($filename) {
include_once "./$filename";
$time = timer_read($timer_id);
$total_time += $time;
print "$name: $time, total: $total_time\n";
$files[$type][$name] = TRUE;
return TRUE;
}
return FALSE;
}
This does not change the behavior, but gives us back the time required to load each module using the include_once() function, as well as a running total.
The output, using APC, looked like this (some module names obscured so as not to identify the web site in public):
0.63 date_api
0.64 views_bonus_tag_cloud
0.71 imagecache_profiles
0.75 flatforum
0.85 [censored]
1.01 views_bonus_grid
1.08 help
1.11 token
1.12 auto_nodetitle
1.21 googleanalytics
1.28 optionwidgets
1.37 ed_readmore
1.41 search404
1.51 thickbox
1.61 custom_breadcrumbs
1.61 simplemenu
1.65 mail_edit
1.74 menutrails
1.92 watchdog
2.16 views_alpha_pager
2.17 blockcache
2.17 text
2.22 scheduler
2.35 front_page
2.42 path
2.47 number
2.5 tagadelic
2.55 persistent_login
2.56 image_attach
2.96 calendar_ical
3.08 image_gallery
3.29 nodereference
3.32 link
3.33 feedback
3.36 service_links
3.37 votingapi
3.91 fieldgroup
4.02 fivestar
4.09 imagefield
4.2 [censored]
4.68 menu
4.74 imagecache
4.79 block
4.93 [censored]
5.25 panels
5.52 logintoboggan
5.73 profile
5.82 upload
5.83 views_theme_wizard
6.07 content
6.21 image
6.45 views_bookmark
6.58 location_views
6.65 search
7.46 tinymce
7.52 forum
7.63 imce
8.24 subscriptions
8.76 filter
9.24 devel
9.29 akismet
9.45 taxonomy
9.54 aggregator
10.27 pathauto
10.36 img_assist
11.66 timeline
11.9 comment
12.01 calendar
12.56 views
12.86 views_ui
12.88 date
13.99 system
16.94 privatemsg
18.32 node
19.38 user
27.09 views_filterblock
79.98 location
172.97 views_rss
174.64 book859.9 Total
Wow! Out of 1150 ms, 860 are spent just loading the modules!
Without APC
So, we disabled APC and got 286.8 ms.
What? no op-code cache/accelerator is better than with APC? Unbelievable ...
APC settings for include_once
Consulting Google's search, it seems that APC has a performance problem with include_once, as mentioned here and here. Versions 3.0.12 and later have a new parameter for improving performance. In a nutshell, this goes like this in your php.ini or apc.ini.
apc.apc.stat = 0
apc.include_once_override = 1
So, we changed APC to have those settings, yet we did not see much difference. Still 800+ ms.
Xcache performance
We then decided to try another op-code cache. We decided to use Xcache, since it is maintained (unlike the best performer, eAccelerator). As a bonus Ubuntu has xcache in the repository, so it can be installed using apt, without the need to built it locally.
The results were very encouraging: total page execution was 288.29 ms, and the drupal_load() was only 66.81 ms.
Example:
Executed 175 queries in 31.03 milliseconds. Page execution time was 288.29 ms.
We now know that APC is indeed the culprit.
Back to APC
But why do the APC settings not improve performance. Something else is at play here.
So, we decided to change APC to use 64 MB of shared memory instead of the default 30 MB. APC uses this memory to cache the parsed and tokenized scripts for later calls. This was done by adding:
apc.shm_size = 64
The results were amazing: total page execution was 253.77 ms, and out of that, only 37.38 ms were from drupal_load()!
Example:
Executed 175 queries in 37.48 milliseconds. Page execution time was 253.77 ms.
This is faster than Xcache, as expected.
No doubt the number of modules uses overflowed the default 30MB, and hence caching was next to useless. Increasing that solved the problem.
What is strange is that removing apc.stat and apc.include_once_override did not seem to have any negative effect on drupal_load()'s performance.
Conclusion
Based on the above tests, we can make the following conclusions:
- We have a happy client, since page generation times are now down from 1150 ms to 254 ms.
- If in doubt, use the apc.php administration front end for APC to know exactly how much of the allocated shared memory you are using.
- Experiment with apc.stat and apc.include_once_override to see if they help in your setup.
- Xcache is a viable option, specially if you find installing APC daunting.
Update
Article updated on Dec 1, 2007.
- The patch to drupal_load() has been modified to print the running total. Output from both cases can be seen below (700 ms vs. 38 ms).
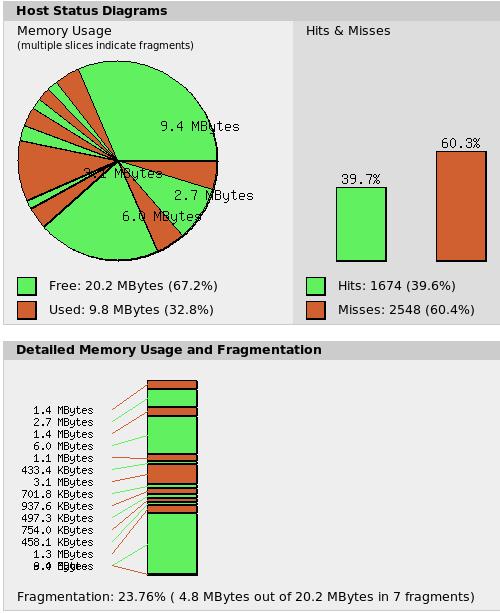
- Below, you will find screenshots from apc.php. Fragmentation is what hurts performance, not the size of memory per se. But it also seems that fragmentation happens when memory is low (in this case, 38MB or less).
Results from drupal_load() with APC using 30 MB
Total is 700 ms.
aggregator: 10.35, total: 10.35
block: 5.21, total: 15.56
book: 6.42, total: 21.98
comment: 13.48, total: 35.46
filter: 10, total: 45.46
forum: 7.97, total: 53.43
help: 1.13, total: 54.56
menu: 5.18, total: 59.74
node: 19.82, total: 79.56
path: 2.57, total: 82.13
profile: 6.5, total: 88.63
search: 7.31, total: 95.94
system: 15.87, total: 111.81
taxonomy: 10.4, total: 122.21
upload: 6.27, total: 128.48
user: 20.93, total: 149.41
watchdog: 2.09, total: 151.5
akismet: 10.77, total: 162.27
[...]: 0.86, total: 163.13
calendar: 13.3, total: 176.43
calendar_ical: 3.31, total: 179.74
content: 6.82, total: 186.56
nodereference: 3.56, total: 190.12
number: 2.67, total: 192.79
optionwidgets: 1.41, total: 194.2
text: 2.43, total: 196.63
date: 14.67, total: 211.3
date_api: 0.67, total: 211.97
googleanalytics: 1.37, total: 213.34
image_attach: 2.71, total: 216.05
image_gallery: 3.38, total: 219.43
image: 6.82, total: 226.25
img_assist: 11.72, total: 237.97
link: 3.51, total: 241.48
panels: 5.82, total: 247.3
pathauto: 11.4, total: 258.7
persistent_login: 2.78, total: 261.48
blockcache: 2.35, total: 263.83
custom_breadcrumbs: 1.74, total: 265.57
[...]: 4.54, total: 270.11
ed_readmore: 1.51, total: 271.62
feedback: 3.81, total: 275.43
fivestar: 4.38, total: 279.81
flatforum: 0.81, total: 280.62
front_page: 2.75, total: 283.37
imagecache: 5.38, total: 288.75
imagecache_profiles: 0.8, total: 289.55
imagefield: 4.49, total: 294.04
imce: 8.74, total: 302.78
[...]: 5.32, total: 308.1
location_views: 6.95, total: 315.05
location: 84.15, total: 399.2
logintoboggan: 6.05, total: 405.25
menutrails: 1.86, total: 407.11
mail_edit: 1.8, total: 408.91
privatemsg: 18.84, total: 427.75
scheduler: 2.37, total: 430.12
search404: 135.56, total: 565.68
service_links: 3.56, total: 569.24
subscriptions: 8.72, total: 577.96
thickbox: 1.7, total: 579.66
timeline: 12.29, total: 591.95
views_alpha_pager: 2.07, total: 594.02
views_bookmark: 6.43, total: 600.45
views_filterblock: 27.55, total: 628
votingapi: 3.39, total: 631.39
simplemenu: 1.67, total: 633.06
tagadelic: 3.37, total: 636.43
tinymce: 11, total: 647.43
views_rss: 1.82, total: 649.25
views_theme_wizard: 6.23, total: 655.48
views_ui: 14.82, total: 670.3
views_bonus_grid: 1.04, total: 671.34
views_bonus_tag_cloud: 0.62, total: 671.96
auto_nodetitle: 1.17, total: 673.13
fieldgroup: 4.06, total: 677.19
token: 1.13, total: 678.32
views: 13.09, total: 691.41
devel: 9.72, total: 701.13
Results from drupal_load() with APC using 48MB
Total is 38 ms, vast improvement.
aggregator: 0.26, total: 0.26
block: 0.13, total: 0.39
book: 0.15, total: 0.54
comment: 0.27, total: 0.81
filter: 0.19, total: 1
forum: 0.2, total: 1.2
help: 0.07, total: 1.27
menu: 0.09, total: 1.36
node: 0.33, total: 1.69
path: 0.08, total: 1.77
profile: 0.17, total: 1.94
search: 0.2, total: 2.14
system: 0.21, total: 2.35
taxonomy: 0.29, total: 2.64
upload: 0.15, total: 2.79
user: 0.54, total: 3.33
watchdog: 0.1, total: 3.43
akismet: 0.28, total: 3.71
[...]: 0.07, total: 3.78
calendar: 0.15, total: 3.93
calendar_ical: 0.09, total: 4.02
content: 0.12, total: 4.14
nodereference: 0.08, total: 4.22
number: 0.07, total: 4.29
optionwidgets: 0.06, total: 4.35
text: 0.07, total: 4.42
date: 0.24, total: 4.66
date_api: 0.14, total: 4.8
googleanalytics: 0.07, total: 4.87
image_attach: 0.1, total: 4.97
image_gallery: 0.12, total: 5.09
image: 0.17, total: 5.26
img_assist: 0.22, total: 5.48
link: 0.1, total: 5.58
panels: 0.12, total: 5.7
pathauto: 0.38, total: 6.08
persistent_login: 0.16, total: 6.24
blockcache: 0.12, total: 6.36
custom_breadcrumbs: 0.09, total: 6.45
[...]: 0.1, total: 6.55
ed_readmore: 0.09, total: 6.64
feedback: 0.11, total: 6.75
fivestar: 0.1, total: 6.85
flatforum: 0.08, total: 6.93
front_page: 0.07, total: 7
imagecache: 0.11, total: 7.11
imagecache_profiles: 0.17, total: 7.28
imagefield: 0.22, total: 7.5
imce: 0.29, total: 7.79
[...]: 1.27, total: 9.06
location_views: 0.24, total: 9.3
location: 20.82, total: 30.12
logintoboggan: 0.22, total: 30.34
menutrails: 0.15, total: 30.49
mail_edit: 0.16, total: 30.65
privatemsg: 0.41, total: 31.06
scheduler: 0.15, total: 31.21
search404: 0.14, total: 31.35
service_links: 0.16, total: 31.51
subscriptions: 0.24, total: 31.75
thickbox: 0.15, total: 31.9
timeline: 0.72, total: 32.62
views_alpha_pager: 0.19, total: 32.81
views_bookmark: 0.21, total: 33.02
views_filterblock: 2.42, total: 35.44
votingapi: 0.19, total: 35.63
simplemenu: 0.14, total: 35.77
tagadelic: 0.19, total: 35.96
tinymce: 0.17, total: 36.13
views_rss: 0.13, total: 36.26
views_theme_wizard: 0.2, total: 36.46
views_ui: 0.25, total: 36.71
views_bonus_grid: 0.13, total: 36.84
views_bonus_tag_cloud: 0.13, total: 36.97
auto_nodetitle: 0.14, total: 37.11
fieldgroup: 0.16, total: 37.27
token: 0.16, total: 37.43
views: 0.44, total: 37.87
devel: 0.32, total: 38.19
Screenshots of apc.php
The following screenshots are taken during the tests. They show that what really hurts is fragmentation.
APC, default settings (i.e. 30 MB shm_size). Note the fragmentation.
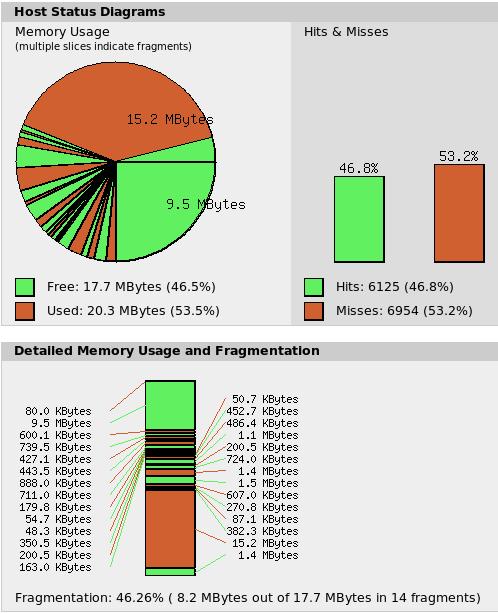
APC, shm_size set to 38. Fragmentation changes from one page to the other, but page time is always 800 ms to 1000 ms.
APC with 38MB, as above, but shows fragmentation. Performance is poor.
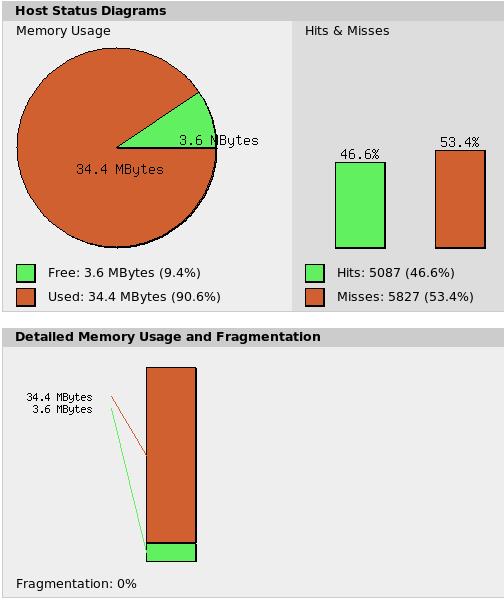
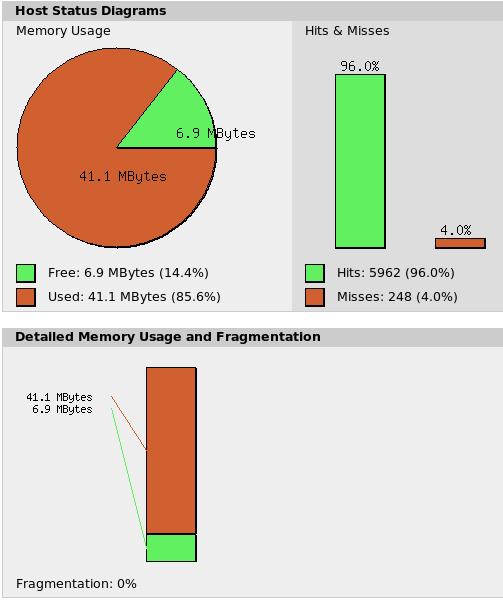
APC, shm_size set to 48. No fragmentation and page loading time is in the low 200s.
Other links
A blog post about APC memory fragmentation caused by the default shmmax parameter not being enough.


Comments
Visitor (not verified)
A very interesting finding
Sat, 2007/12/01 - 00:42One question - when you looked at the APC status page (apc.php) was it showing the cache as full (or nearly full)? If so then are you sure this is related to include_once() at all, because it could also be explained by APC simply not being able to cache everything, and then having to 'context switch' back to parse the code which did not fit in the cache. The 'context switching' could surely be enough to decrease performance more than vanilla php.
If, on the other hand the cache was not showing as full, then this does indeed look like some architectural limitation with APC, which could definitely be related to include_once() and apc.include_once_override.
Either way, thanks for sharing your finding :)
Khalid
Fragmentation of shared memory
Sat, 2007/12/01 - 14:54I updated the article with a newer patched version of drupal_load. It prints a running total so no external calculation is needed.
I also included graphs from apc.php. The only correlation to bad performance is fragmentation that happens in APC when memory is low.
I did not use either of apc.stat or apc.include_once_override. Performance just improved when enough memory was given to APC (between 38MB and 48MB in this case).
--
2bits -- Drupal and Backdrop CMS consulting
Visitor (not verified)
"Wow! Out of 1150 ms, 860
Mon, 2008/02/11 - 21:56"Wow! Out of 1150 ms, 860 are spent just loading the modules!"
You were adding the time results in the script, so why did you add them together in the end? Should it not be the 140 whatever ms that the last module displayed? Sorry if someone mentioned this already
Visitor (not verified)
Strange setup
Sat, 2007/12/01 - 11:36Hi Khalid,
I think your client's setup is somehow strange. I've tried your measurement on scratch.d.o and only 3 of the modules we use take longer than 1 ms to load. We use apc as you know but don't use the settings (apc.apc.stat = 0 and apc.include_once_override = 1 ) you recommend. We have however allocated 128 MB for storage.
APC actually comes with a nice file that let's you see how effective the APC cache is used.
Cheers,
Gerhard
Khalid
Neither did I use them
Sat, 2007/12/01 - 14:55By the way, I am using APC 3.0.15 (latest).
I did not use either of these parameters either. Once APC got enough shared memory, performance did improve, without any need for those parameters.
I updated the article with graphs. Check my reply to grugnog above. You will find the output from drupal_load() before and after APC got enough memory.
--
2bits -- Drupal and Backdrop CMS consulting
Visitor (not verified)
Need to pass this on
Sat, 2007/12/01 - 16:28I will need to pass this on to our dedicated server provider. Since we pay for special hosting for all our Drupal and non-Drupal sites, they should be able to implement much of these ideas (if they haven't already).
Thanks for taking the time to write this up.
Visitor (not verified)
awesome!
Sun, 2007/12/02 - 06:12Hi Khalid,
Thanks for an awesome and informative article, that is another great help to our (neverending) quest of increased performance. When I initially set apc.stat to 0 we noted a small improvement in performance. I will retest, and see if this is still the case.
Visitor (not verified)
Awesome
Fri, 2007/12/07 - 12:38Once again it is an axcellent finding, thank you for sharing it. It has divided by 3 the time of generation of the page of one of our site (not rue89.com this time, even if it has also been benefical for rue89).
You are really a gold mine for Drupal high-performance !
Visitor (not verified)
grat
Tue, 2008/01/22 - 13:51Yes
Thats really great article
Visitor (not verified)
APC vs eAccelerator
Fri, 2007/12/14 - 16:23Hi,
In a previous article you mention that eAccelerator was more efficient than APC.
Do you know if eAccelerator suffers from the same type of performance issues mentioned here?
Pages