A recent client performance assessment consulting project showed that on their site, the main page that logged in users would browse is slow. Tuning the server for memory and disk throughput helped somewhat, but did not fully eliminate the issue.
Looking at the page, it was a view, and the total time was around 2.75 seconds.
The main query was not efficient, with lots of left joins, and lots of filtering criteria:
SELECT node.nid AS nid,
... AS ...
... AS ...
'node' AS field_data_field_aaa_node_entity_type,
'node' AS field_data_field_bbb_node_entity_type,
'node' AS field_data_field_ccc_node_entity_type,
... AS ...
FROM node
INNER JOIN ... ON node.uid = ...
LEFT JOIN ... ON ... = ...  AND ... = ...
LEFT JOIN ... ON ... = ... AND (... = '12'
OR ... = '11'
OR ... = '15'
OR ... = '24')
WHERE (( (node.status = '1')
AND (node.type IN ('something'))
AND (... <> '0')
AND ((... <> '1') )
AND ((... = '4'))
AND (... IS NULL ) ))
ORDER  BY  ... DESC
LIMIT  51   OFFSET 0
That caused the first pass to sift through over 24,000 rows, while using both file sort and temporary tables. Both operations are disk intensive.
*************************** 1. row ***************************
           id: 1
  select_type: SIMPLE
        table: ...
   partitions: NULL
         type: range
possible_keys: PRIMARY,...
          key: rid
      key_len: 8
          ref: NULL
         rows: 24039
     filtered: 100.00
        Extra: Using where; Using index; Using temporary; Using filesort
*************************** 2. row ***************************
           id: 1
  select_type: SIMPLE
        table: ...
   partitions: NULL
         type: eq_ref
possible_keys: PRIMARY,status
          key: PRIMARY
      key_len: 4
          ref: test43....
         rows: 1
     filtered: 50.00
        Extra: Using where
*************************** 3. row ***************************
           id: 1
  select_type: SIMPLE
        table: node
   partitions: NULL
         type: ref
possible_keys: uid,status,type,node_status_type
          key: uid
      key_len: 4
          ref: test43....
         rows: 5
     filtered: 12.18
        Extra: Using index condition; Using where
*************************** 4. row ***************************
           id: 1
  select_type: SIMPLE
        table: ...
   partitions: NULL
         type: ref
possible_keys: PRIMARY,...
          key: PRIMARY
      key_len: 4
          ref: test43....
         rows: 2
     filtered: 54.50
        Extra: Using where; Not exists; Using index
But here is the puzzle: this query took 250 to 450 milliseconds at most.
Where did the rest of the 2,750 milliseconds go?
To find out, we use xhprof, the profiler for PHP.
In the screenshot below, you can see that the total page processing time (Total Inc. Wall Time, top right) is 2,732 milliseconds.
Out of that, 85% is in database queries (252 total queries, totaling 2,326 milliseconds, Excl.Wall Time).
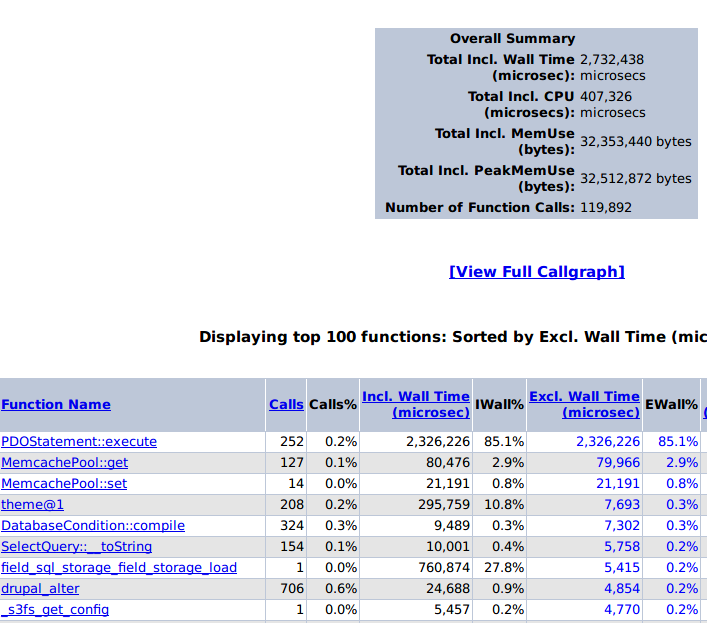
What are these queries?
They are queries to other tables in the database to retrieve fields for each row.
For example, if you have a product view, with certain criteria, the result still has to get the product name, its price, its image, ...etc.
All these queries add up, specially when you are loading 50 of them. The time needed to retrieve each field, and rendering it for output is multiplied by the number of rows retrieved.
So, how do you mitigate that overhead? There are several ways:
- Reduce the number of rows returned by the view. For example, instead of 50, make it 25. That would half the number of queries (and processing) needed to produce the page.
- If the query is the same for all logged in users, then enable views caching (under Advanced when you edit the view), and enable both Query Result and Rendered Output caching. Use time based caching, for as long as practical to your site (e.g. if you add products or change prices only once a day, then you can cache the results for 20 hours or more).
- Use a fast caching layer, such as the memcache module, instead of the default database caching, which will be slow for a site with many logged in users.
- Use View Lite Pager to eliminate COUNT queries from being performed.
- Consider alternate approaches to views, such as Apache Solr Faceted Search, which has much better performance than MySQL based solutions, because they do build an efficient index.
By implementing all the above for the client in question, except the last one, we were able to bring the view page from 2,730 milliseconds, down to 700-800 milliseconds of response time.
Scalability was much better, with the same server could handle more logged in users.


Comments
Drupal developm... (not verified)
Drupal modules
Thu, 2019/10/03 - 06:55Hello,
Such a nice piece of content about the most popular content management system Drupal, we are waiting for the content related to the latest Drupal updates and features of its modules.
waiting for your next blog
thanks