A client site was facing intermittent outages, specially at peak hours.
We investigated the issue over a few days, and narrowed down the cause to certain slow queries, described in more details below.
They had tagadelic on every page, displaying a tag cloud, and from that, crawlers hit every term to paths like taxonomy/term/1581.
Slow queries causing server outage
As more of these queries got executed simultaneously, things get worse and worse, because the temporary tables generated by this query are on disk, and the disk gets busier, and more queries keep coming in the meantime, making the disk even busier, and slower in processing the queries.
This is not a good situation, since not only does it lead to slowdowns, but also to outages as more PHP processes are tied up by slow queries ...
Relevant site statistics
First, the site's relevant statistics are as follows:
40,751 rows in the node table
82,529 rows in the term_node table
79,832 rows in the node_access table
The slow query in question was responsible for combined total of 73.3% of the overall total slow query time for all queries. Out of this, 39.8% were from the query itself, and 33.5% were from the COUNT query associated with it.
EXPLAIN output for the query
The slow query that was bogging down the site looked like this, from the taxonomy module, in the function taxonomy_select_nodes():
EXPLAIN
SELECT DISTINCT(n.nid), n.sticky, n.title, n.created
FROM node n
INNER JOIN term_node tn0  ON n.vid  = tn0.vid
INNER JOIN node_access na ON na.nid = n.nid
WHERE (
  na.grant_view >= 1 AND
  (
    (na.gid = 0 AND na.realm = 'all') OR
    (na.gid = 1 AND na.realm = 'job_view') OR
    (na.gid = 0 AND na.realm = 'resume_owner') OR
    (na.gid = 0 AND na.realm = 'og_public')
  )
)
AND
(
  n.status = 1  AND
  tn0.tid IN (1581)
)
ORDER BY n.sticky DESC, n.created DESC
LIMIT 0, 15\G
*************************** 1. row ***************************
           id: 1
  select_type: SIMPLE
        table: n
         type: range
possible_keys: PRIMARY,vid,node_status_type
          key: node_status_type
      key_len: 4
          ref: NULL
         rows: 40751
        Extra: Using where; Using temporary; Using filesort
*************************** 2. row ***************************
           id: 1
  select_type: SIMPLE
        table: na
         type: ref
possible_keys: PRIMARY,grant_view_index
          key: PRIMARY
      key_len: 4
          ref: live.n.nid
         rows: 1
        Extra: Using where; Distinct
*************************** 3. row ***************************
           id: 1
  select_type: SIMPLE
        table: tn0
         type: ref
possible_keys: vid
          key: vid
      key_len: 4
          ref: live.n.vid
         rows: 1
        Extra: Using where; Distinct
Both the node and term_node tables have many rows, and adding to that is the node_access table. An extra join is done on that table which also contaings many rows.
So, for the sake of diagnosis, we rewrote the query without the node _access table, like so:
EXPLAIN
SELECT DISTINCT(n.nid), n.sticky, n.title, n.created
FROM node n
INNER JOIN term_node tn0 ON n.vid = tn0.vid
WHERE n.status = 1  AND
tn0.tid IN (1581)
ORDER BY n.sticky DESC, n.created DESC
LIMIT 0, 15\G
*************************** 1. row ***************************
           id: 1
  select_type: SIMPLE
        table: n
         type: range
possible_keys: vid,node_status_type
          key: node_status_type
      key_len: 4
          ref: NULL
         rows: 40751
        Extra: Using where; Using temporary; Using filesort
*************************** 2. row ***************************
           id: 1
  select_type: SIMPLE
        table: tn0
         type: ref
possible_keys: vid
          key: vid
      key_len: 4
          ref: live.n.vid
         rows: 1
        Extra: Using where; Distinct
We eliminate a join, but everything else remains the same, including the temporary table and filesort.
Timing the two scenarios: Using MySQL profiling
We then proceeded to time the two queries in a controlled manner, using two methods, first using MySQL profiling, which is only in 5.0.37 or later, and the Community Edition only.
To do this, you execute the following command on MySQL's command line:
SET PROFILING = 1;
This enables profiling for your session.
You then execute the two above queries, one after the other.
After that, you enter the following command:
SHOW PROFILES;
The output will show the time for each query, and the SQL for it (which we abbreviated for brevity):
+----------+------------+
|        1 | 1.40426500 | SELECT SQL_NO_CACHE DISTINCT(n.nid), ...
|        2 | 0.30603500 | SELECT SQL_NO_CACHE DISTINCT(n.nid), ...
+----------+------------+
Clearly the times are different.
You can also glean more valuable info on resource usage, by querying the information_schema database's profiling table, as follows. The SQL filters all states that take less than 1 milliseconds, again for brevity.
For the original query, with node_access joined, we get:
SELECT state, duration, cpu_user+cpu_system AS cpu,
block_ops_in+block_ops_out AS blocks_ops
FROM information_schema.profiling
WHERE query_id = 1 AND
duration > 0.000999;
+----------------------+----------+------+------------+
| state                | duration | cpu  | blocks_ops |
+----------------------+----------+------+------------+
| Copying to tmp table | 1.403615 | 1.68 |        128 |
+----------------------+----------+------+------------+
For the second query without the node_access join, we get:
SELECT state, duration, cpu_user+cpu_system AS cpu,
block_ops_in+block_ops_out AS blocks_ops
FROM information_schema.profiling
WHERE query_id = 2 AND
duration > 0.000999;
+----------------------+----------+------+------------+
| state                | duration | cpu  | blocks_ops |
+----------------------+----------+------+------------+
| Copying to tmp table | 0.305544 | 0.35 |          8 |
+----------------------+----------+------+------------+
As you can see, the CPU usage and the block I/O operations are far less when we eliminate the node_access join.
Timing the two scenarios: custom PHP script
If you don't have a MySQL version that supports profiling, you can time the two queries using a simple custom script.
The server is a medium one with normal specs (8 cores, 8GB of RAM, and a separate disk for MySQL).
The PHP script boots Drupal then executes both variations of the query, measuring the time for each.
Note that we added SQL_NO_CACHE to the query to force it to bypass the query cache of MySQL:
<?phprequire_once './includes/bootstrap.inc';drupal_bootstrap(DRUPAL_BOOTSTRAP_FULL);// We have an array with the query type, and the query SQL$q = array( 'before' => " SELECT SQL_NO_CACHE DISTINCT(n.nid), n.sticky, n.title, n.created FROM node n INNER JOIN term_node tn0 ON n.vid = tn0.vid INNER JOIN node_access na ON na.nid = n.nid WHERE ( na.grant_view >= 1 AND ( (na.gid = 0 AND na.realm = 'all') OR (na.gid = 1 AND na.realm = 'job_view') OR (na.gid = 0 AND na.realm = 'resume_owner') OR (na.gid = 0 AND na.realm = 'og_public') ) ) AND ( n.status = 1 AND tn0.tid IN (1581) ) ORDER BY n.sticky DESC, n.created DESC LIMIT 0, 15", 'after' => " SELECT SQL_NO_CACHE DISTINCT(n.nid), n.sticky, n.title, n.created FROM node n INNER JOIN term_node tn0 ON n.vid = tn0.vid WHERE n.status = 1 AND tn0.tid IN (1581) ORDER BY n.sticky DESC, n.created DESC LIMIT 0, 15",);$result = array();// Execute each SQL, measuring it in the processforeach($q as $type => $query) { timer_start($type); $result[$type] = db_query($query); print "$type:\t" . timer_read($type) . "\n";}?>
We save that to a file called query_time.php, and run it like so:
cd /var/www
php /somewhere/query_time.php
You can also run it directly from a browser, if you do not have shell access, or if you don't have PHP CLI installed.
For that, you need to r eplace this line:
print "$type:\t" . timer_read($type) . "\n";
With
  print "$type: " . timer_read($type) . "
";
For HTML output in the browser, you also need to have the script in the same directory that has Drupal core's index.php.
Analyzing the results
Whatever way you run the above script, the output will look like this:
before: 1597.86
after:   299.9
As you can see, there is a significant difference when having node_access vs. eliminating it from the query. The difference above is more than 5X.
Running it several times, and getting slightly different results each time, we concluded that at least a 4X improvement is possible with this modification.
This means that eliminating the node_access part from the query was going to improve the site by eliminating slowdowns and outages.
Quick Solution: Hack core!
The quick solution was to patch the taxnomony.module in the function taxonomy_select_nodes() to comment out the two db_rewrite_sql() calls.
However, since the site has some private data, we had to protect it in some ways. It turned out that for this site, the private nodes all belonged to one term, 63, and therefore the following patch will bypass the node_access join only when the path is /taxonomy/term/zzz, and return nothing if the visitor is going to term 63 specifically. For other paths, normal access control will apply and those authorized to see the private content will continue to be able to do so:
-    $sql = db_rewrite_sql($sql);
-    $sql_count = db_rewrite_sql($sql_count);
+    if (in_array(63, $tids)) {
+      // Do not display private nodes...
+      return NULL;
+    }
+    // Skip the node_access stuff reducing execution time for queries
+    // $sql = db_rewrite_sql($sql);
+    // $sql_count = db_rewrite_sql($sql_count);
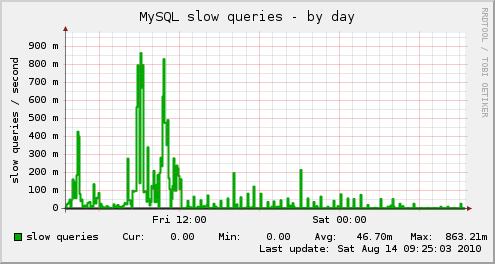
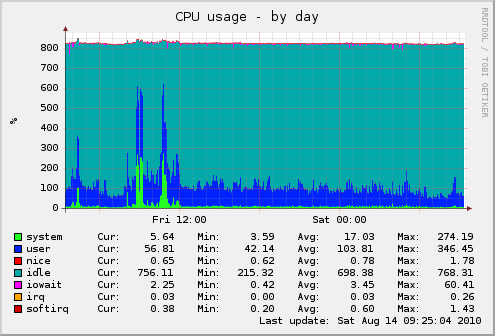
This improved the server performance significantly, as you can see in the graphs below:
MySQL Slow queries reduced significantly:
The load average is back to a normal number, with no spikes:

CPU usage is also normal, with no spikes:
The drawbacks of the above solution is that it uses a hack to core, which has to be maintained in version control for future core upgrades.
Long Term Solution: Separate site
The long term solution though, is to separate the private stuff to its own site with its own subdomain (e.g. private.example.com) and a separate database. The bakery module as a single signon solution. Bakery does not synchronize roles across sites though, and that has to be managed manually, until the feature request in #547524 is implemented.
Further reading
Incidentally, this is not the first time that we had to bypass node access to resolve performance bottlenecks caused by slow queries. Read How Drupal's node_access table can negatively impact site performance for a similar case.


Comments
Visitor (not verified)
There are also many
Mon, 2010/08/16 - 02:50There are also many performance problems with views and node access.
There is a patch commited in the latest 6.x-3.x-dev of views which allows to configure to disable db_rewrite_sql per view.
Khalid
Extra join
Mon, 2010/08/16 - 11:12It is an extra join, so it will have overhead anywhere it is used. With views, I saw this patch go in, and it is a good option to have for sites that need it. But for core, there is no such option. So we have to hack ... kittens and all.
Visitor (not verified)
But in your particular
Mon, 2010/08/16 - 21:32But in your particular example you can make Views generate the term pages.
Khalid
Perhaps later
Mon, 2010/08/16 - 22:03Yes, we can.
I am not sure if that option is in the latest stable release of views 2.x or not though.
I can't find the relevant issue right now, only ones that were marked as duplicate to a core issue.
Visitor (not verified)
Broken Link
Mon, 2010/08/16 - 04:59Your link in the "Further Reading" section produces a 404. ;)
Khalid
Fixed
Mon, 2010/08/16 - 11:10Thanks for pointing this out. It is now fixed.
Visitor (not verified)
Thanks for the analysis
Mon, 2010/08/16 - 10:22Thanks for the analysis Khalid.
I've made similar hacks in the past. For one site node access was only used while a node was unpublished (for workflow control). Once a node was published it was viewable by anyone, and only authenticated users be part of the workflow. So it was a simple hack to bypass node_access if !$user->uid.
Visitor (not verified)
Was Page Caching Turned On?
Mon, 2010/08/16 - 12:41You don't really mention it that I saw, so I'm curious - was page caching turned on? Since the source of the slowdown sounded like webcrawlers hitting links to these pages, wouldn't having the pages cached for anonymous users prevent so much database thrashing? Add in a little memcache, and they're hitting the database even less.
Khalid
Caching is enabled, with memcache
Mon, 2010/08/16 - 12:51Yes, page caching is enabled, and memcache is used too.
Cache lifetime is set to 15 minutes.
Because they use tags and have a long list of them, combined with the fact that paths like /taxonomy/term/zzz have a pager at the bottom, and many of them have many pages. Each page is cached independently, and crawlers keep hitting the next page and the next and the next, ...etc.