Here is a case study where a module caused extremely poor performance on a site with heavy traffic.
Background
A client with an ever growing site contacted us for some emergency diagnosis and tuning. The site took a long time to respond, and it was not showing any pages to visitors
Diagnosis
Upon investigation we found that the node table has 27007 rows, while the term_node table has 126419. Not specially huge, but still sizeable.
Running SHOW PROCESSLIST in MySQL showed many instances of the the following query running for half a minute to a minute, with a status of "Copying to tmp table".
An explain shows that the query indeed uses a temporary table and a filesort.
mysql> explain SELECT t.tid, COUNT(n.nid) AS c FROM term_node t
INNER JOIN node n ON t.nid = n.nid WHERE n.status = 1 GROUP BY t.tid;
+-------+--------+-------+-------+----------------------------------------------+
| table | key    | ref   | rows  | Extra                                        |
+-------+--------+-------+-------+----------------------------------------------+
| n     | status | const | 13442 | Using index; Using temporary; Using filesort |
| t     | nid    | n.nid |     5 |                                              |
+-------+--------+------ +-------+----------------------------------------------+
We traced this query to the taxonomy module function taxonomy_term_count_nodes(), but it is called from the taxonomy_dhtml module which places a block on every page with all categories and number of nodes for each.
Moreover, for devel, the page load times were:
Executed 221 queries in 419.57 milliseconds. Page execution time was 1165.34 ms.
Executed 221 queries in 121.04 milliseconds. Page execution time was 830.7 ms.
In one extreme case, devel showed the following:
Executed 235 queries in 128043.47 milliseconds. Page execution time was 129189.38 ms.
The concerned query alone took 110298.44 milliseconds in that case.
taxonomy_term_count_nodes SELECT t.tid, COUNT(n.nid) AS c FROM term_node t INNER JOIN node n ON t.nid = n.nid WHERE n.status = 1 GROUP BY t.tid
More than 2 minutes for a page load! Totally unacceptable.
Solution
Sometimes, tuning is about tradoffs: reduced functionality is better than full functionality from the features point of view, but having the site not accessible at all.
The function in question is recursive, and causes a static variable to hold an array of terms and nodes.
The function is like this:
function taxonomy_dhtml_term_count_nodes($tid = 0, $type = NULL) {
if ($type) {
$count = db_result(db_query(db_rewrite_sql("SELECT COUNT(n.nid) AS c
FROM {term_node} t INNER JOIN {node} n ON t.nid = n.nid
WHERE t.tid = %d n.status = 1 AND n.type = '%s'"), $tid, $type));
}
else {
$count = db_result(db_query(db_rewrite_sql('SELECT COUNT(n.nid) AS c
FROM {term_node} t INNER JOIN {node} n ON t.nid = n.nid
WHERE t.tid = %d AND n.status = 1'), $tid));
}
return $count;
}
So, a patch was devised for the taxonomy_dhtml module to use its own query.
A patch for the Drupal 5 version is attached. It should work with little or no work on Drupal 4.7. Drupal 6 has some differences in this query.
Note that other modules use this function, and some of them can benefit from a similar workaround.
These modules are:
- directory
- download
- ed_classified
- flash_gallery
- glossary
- gojoingo
- image
- image_pub
- jsdomenu
- node_browser
- og_vocab
- postcard
- project
- sitebrowser
- sitedoc
- site_map
- sitemenu
- syndication
- sysinfo
- taxonomy_batch_operations
- taxonomy_html
- taxonomy_multiedit
- taxonomy_similar
- ubercart
- views_bonus
Results after tuning
After the above was implemented, we now see a much better picture. For example, the front page with the categories block on it shows the following times:
Executed 256 queries in 213.5 milliseconds. Page execution time was 525.86 ms.
Executed 257 queries in 102.6 milliseconds. Page execution time was 432.66 ms.
Executed 256 queries in 64.62 milliseconds. Page execution time was 309.14 ms.
Not only that, but also Apache process resident set size went from 26 MB down to 17 MB, so good memory saving by this patch too.
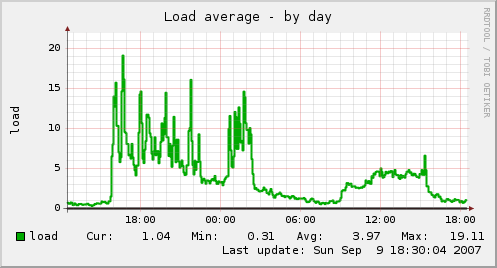
But a picture is worth a thousand words, so let us look at the Munin graph.
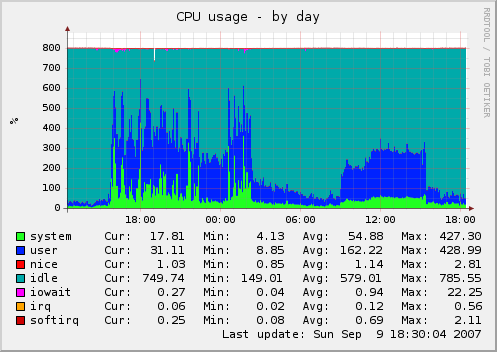
As you can see, at 16:00 the server had MaxClients increased, since it is now not a VPS but a dedicated server with 8GB of RAM and two Quad core CPUs. Observe the surge in CPU utilization because we now have 256 Apache processes instead of just 20.
The incoming onslaught caused the bottleneck above to show. Then at 02:00, the above fix for taxonomy_dhtml was implemented and you can see the effect of that reducing CPU usage to more sane levels.
You can also see the load average going down too, since the number of processes waiting for the database is much less.
There is another bottleneck at 3 am, uncovered by a surge in traffic, relating to img_assist, which was worked around, but that is another story.
| Attachment | Size |
|---|---|
| 1.65 KB |


Comments
Visitor (not verified)
Caching
Mon, 2007/09/10 - 08:20I think taxonomy queries like this one should make us think again about the whole model being used for them. I had similar memory issues when working on taxonomy_context, and I know users of glossary.module have similar problems on large glossaries too.
The idea is to rely on taxonomy.module-controlled caching: since updates to vocabularies are in most cases even much less frequent than node updates, it could make sense to keep the whole tree for each vocabulary in cache when it is computed, and invalidate the cache when a term is updated. Building the tree would happen only once on the next request needing it ; not on each term update since, when freetagging vocabularies are involved, terms updates tend to be grouped.
Then, any need for something in a given vocabulary could be anwered in just one simple query to get the data from cache instead of the myriad heavy queries involved in your case.
I'd bet the gain would be even more substantial.
Visitor (not verified)
This looks plain scary. CCK
Thu, 2007/10/04 - 23:13This looks plain scary. CCK Select List here I come.
Khalid
Reported
Mon, 2007/09/17 - 22:20Reported as an issue here http://drupal.org/node/176518
--
2bits -- Drupal and Backdrop CMS consulting
Visitor (not verified)
Why not
Fri, 2007/10/05 - 19:12Why not simply it even more. If all you want is the count of nodes with a term, then just do this: SELECT count(nid) FROM `term_node` WHERE tid=28' -- no joins, but it will count unpublished nodes.
Visitor (not verified)
start
Fri, 2007/12/07 - 02:51My tip: start with log slow query, then go from there, works for me every time.
Khalid
Not in every case
Fri, 2007/12/07 - 09:50This would work for only one cause of slow downs: queries that take a long time to execute.
It will not help at all with other slow downs caused by other reasons (e.g. lots of fast executing queries, lots of modules to load, modules that communicate over the net, ...etc.)
--
2bits -- Drupal and Backdrop CMS consulting