We've released a new module for performance logging and monitoring of Drupal sites.
The module shows pages and how much memory they are using for each page load, as well as the milliseconds of page generation time for each as well.
The module is intended for developers as they are building and testing sites, as well as site administrators to measure the most resource hungry pages.
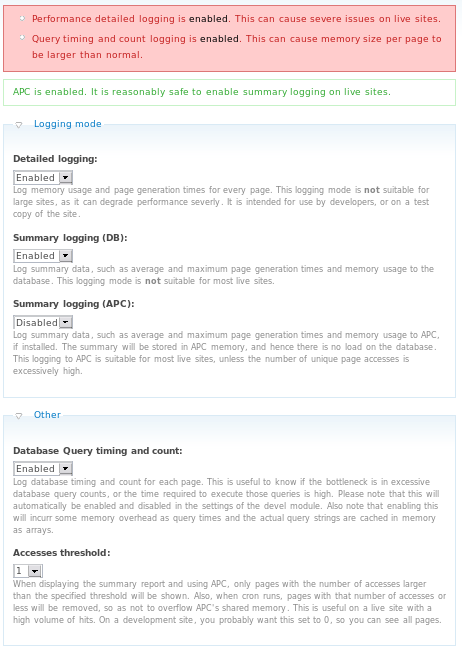
Performance Logging Settings
Here is the settings page. By default the module does not do any logging, and all the options are set to Disabled. The site administrator has to explicitly enable either detailed logging, summary logging to the database, or summary logging to APC, or a combination of them. Warnings are displayed if it is not safe to enable such options on live sites (causes more database load or locking).
This has two modes that are automatically detected. If APC is installed then the logging will happen in APC's shared memory, and therefore has no performance hit on a live site. If APC is not installed, then the logging happens to the database, and therefore, it is only suitable for development use on test sites.
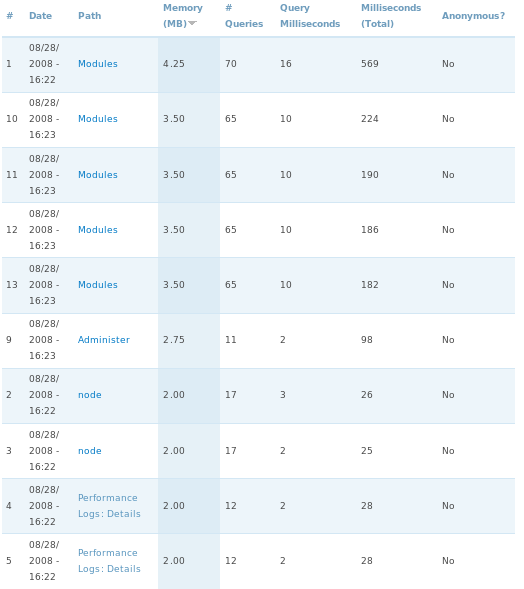
Performance Logging Details
Here is the detailed view page. Do not enable this on a live site, since it can place a severe load on the database, and can detrimental for site performance. Use it only on test sites:
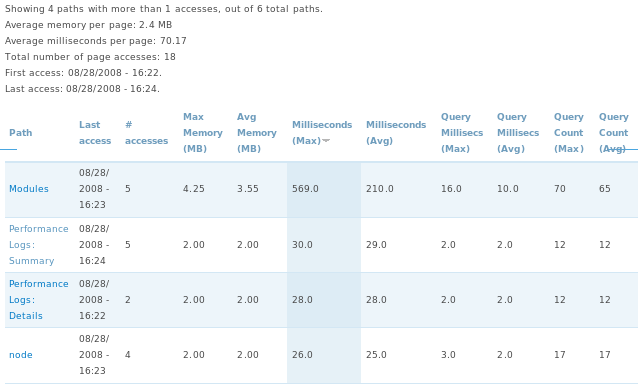
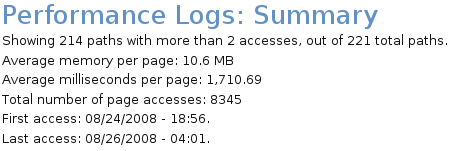
Performance Logging Summary
Here is the summary view page. Note the info at the top of the report, which gives a nice overview of the site so far.
Future Development and To Do List
There is a To Do list in the module's issue queue. Please submit patches if you can help with any of them.
Screenshots from live sites
The following screenshots are from live sites. Each with its own quirks and issues:
The following site uses views and CCK extensively, and is "block heavy". It has 81 modules enabled. Therefore memory is the issue, with an average of 10MB of PHP memory per process.
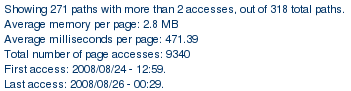
This other site is very lean when it comes to memory, since it does not use views or CCK. It has 52 modules and 1 theme enabled. Only 2.8MB per process.
Page execution time is also quite good at 471 milliseconds.
A third site is still doing very well when it comes to memory consumption. It has 60 modules enabled, and not a lot of blocks usage is heavy.
As you can see, Drupal sites can be quite different, because of the almost infinite ways Drupal can be configured. This module helps profile where the bottlenecks are so your site can run better.


Comments
Visitor (not verified)
I just had a quick run with
Sun, 2008/08/24 - 15:06I just had a quick run with it, Its a excellent resource IMO. I mean devel does give a memory usage stats but its not very intuitive and not very easy to read as this is. Also real power comes with APC enabled on live site. I'll look at TODO's and would be happy to contribute.
Visitor (not verified)
should this be in devel?
Mon, 2008/08/25 - 02:48I think this would be a good addition for devel module. We need to start being a bit more active about trying to reduce and merge the number of modules in contrib, especially the very useful ones.
Khalid
Now in devel
Mon, 2008/10/20 - 21:10As of today, the module is part of the devel module.
It also got a 6.x version and a 7.x version. Download the respective -dev releases of devel to get the module.
--
2bits -- Drupal and Backdrop CMS consulting
Dzmitry (not verified)
Thank you for module, I'll
Tue, 2012/08/14 - 04:01Thank you for module, I'll try to use it necessarily. Do you know another modules for performance testing of Drupal? Such as http://community.blazemeter.com/knowledgebase/articles/73566-blazemeter-drupal-module?