We discussed the topic of the open buffet binge syndrome, where web sites "gorge" on contributed modules, and cause site performance to be slow and memory utilization to be high.
We encountered an interesting case recently while doing work for a client. The main symptom was page execution time that is high (800 to 1200 ms), but database query time that is low.
The normal case is where the total page execution time is high, and
a significant portion of that is due to database queries. Using the
devel module we can identify those and work on tuning the module, or
the database to squeeze more performance.
In this case, it was the other way around. For example:
Executed 175 queries in 43.46 milliseconds. Page execution time was 1150.73 ms.
Why would queries take only 43 ms, yet the whole page execution is 1150 ms? Where are the 1107 ms spent? This is too high.
So, in order to troubleshoot this we replicated the site to our test servers, and proceeded to investigate. Our test server runs APC, so PHP time should not be high at all.
Using xdebug and kcachegrind, we narrowed down the problem to the drupal_load() function, where most of the time was spent.
Seeing that this function does include_once() for every module, that was the place to investigate.
Measuring include_once
First we changed the drupal_load() function to look like this:
function drupal_load($type, $name) {
static $files = array(), $total_time = 0;
if (isset($files[$type][$name])) {
return TRUE;
}
$timer_id = 'include ' . $name;
timer_start($timer_id);
$filename = drupal_get_filename($type, $name);
if ($filename) {
include_once "./$filename";
$time = timer_read($timer_id);
$total_time += $time;
print "$name: $time, total: $total_time\n";
$files[$type][$name] = TRUE;
return TRUE;
}
return FALSE;
}
This does not change the behavior, but gives us back the time required to load each module using the include_once() function, as well as a running total.
The output, using APC, looked like this (some module names obscured so as not to identify the web site in public):
0.63 date_api
0.64 views_bonus_tag_cloud
0.71 imagecache_profiles
0.75 flatforum
0.85 [censored]
1.01 views_bonus_grid
1.08 help
1.11 token
1.12 auto_nodetitle
1.21 googleanalytics
1.28 optionwidgets
1.37 ed_readmore
1.41 search404
1.51 thickbox
1.61 custom_breadcrumbs
1.61 simplemenu
1.65 mail_edit
1.74 menutrails
1.92 watchdog
2.16 views_alpha_pager
2.17 blockcache
2.17 text
2.22 scheduler
2.35 front_page
2.42 path
2.47 number
2.5 tagadelic
2.55 persistent_login
2.56 image_attach
2.96 calendar_ical
3.08 image_gallery
3.29 nodereference
3.32 link
3.33 feedback
3.36 service_links
3.37 votingapi
3.91 fieldgroup
4.02 fivestar
4.09 imagefield
4.2 [censored]
4.68 menu
4.74 imagecache
4.79 block
4.93 [censored]
5.25 panels
5.52 logintoboggan
5.73 profile
5.82 upload
5.83 views_theme_wizard
6.07 content
6.21 image
6.45 views_bookmark
6.58 location_views
6.65 search
7.46 tinymce
7.52 forum
7.63 imce
8.24 subscriptions
8.76 filter
9.24 devel
9.29 akismet
9.45 taxonomy
9.54 aggregator
10.27 pathauto
10.36 img_assist
11.66 timeline
11.9 comment
12.01 calendar
12.56 views
12.86 views_ui
12.88 date
13.99 system
16.94 privatemsg
18.32 node
19.38 user
27.09 views_filterblock
79.98 location
172.97 views_rss
174.64 book859.9 Total
Wow! Out of 1150 ms, 860 are spent just loading the modules!
Without APC
So, we disabled APC and got 286.8 ms.
What? no op-code cache/accelerator is better than with APC? Unbelievable ...
APC settings for include_once
Consulting Google's search, it seems that APC has a performance problem with include_once, as mentioned here and here. Versions 3.0.12 and later have a new parameter for improving performance. In a nutshell, this goes like this in your php.ini or apc.ini.
apc.apc.stat = 0
apc.include_once_override = 1
So, we changed APC to have those settings, yet we did not see much difference. Still 800+ ms.
Xcache performance
We then decided to try another op-code cache. We decided to use Xcache, since it is maintained (unlike the best performer, eAccelerator). As a bonus Ubuntu has xcache in the repository, so it can be installed using apt, without the need to built it locally.
The results were very encouraging: total page execution was 288.29 ms, and the drupal_load() was only 66.81 ms.
Example:
Executed 175 queries in 31.03 milliseconds. Page execution time was 288.29 ms.
We now know that APC is indeed the culprit.
Back to APC
But why do the APC settings not improve performance. Something else is at play here.
So, we decided to change APC to use 64 MB of shared memory instead of the default 30 MB. APC uses this memory to cache the parsed and tokenized scripts for later calls. This was done by adding:
apc.shm_size = 64
The results were amazing: total page execution was 253.77 ms, and out of that, only 37.38 ms were from drupal_load()!
Example:
Executed 175 queries in 37.48 milliseconds. Page execution time was 253.77 ms.
This is faster than Xcache, as expected.
No doubt the number of modules uses overflowed the default 30MB, and hence caching was next to useless. Increasing that solved the problem.
What is strange is that removing apc.stat and apc.include_once_override did not seem to have any negative effect on drupal_load()'s performance.
Conclusion
Based on the above tests, we can make the following conclusions:
- We have a happy client, since page generation times are now down from 1150 ms to 254 ms.
- If in doubt, use the apc.php administration front end for APC to know exactly how much of the allocated shared memory you are using.
- Experiment with apc.stat and apc.include_once_override to see if they help in your setup.
- Xcache is a viable option, specially if you find installing APC daunting.
Update
Article updated on Dec 1, 2007.
- The patch to drupal_load() has been modified to print the running total. Output from both cases can be seen below (700 ms vs. 38 ms).
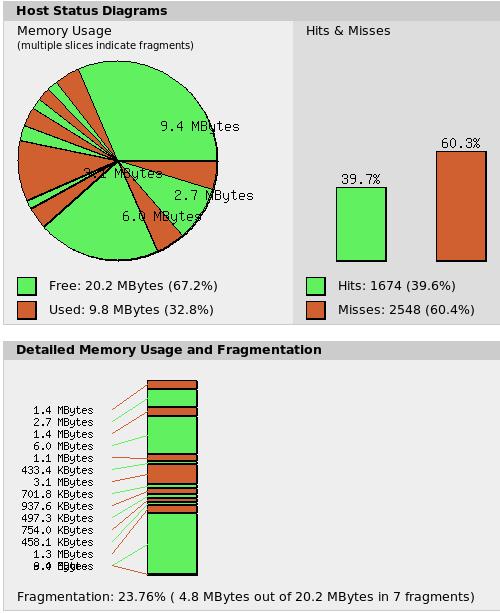
- Below, you will find screenshots from apc.php. Fragmentation is what hurts performance, not the size of memory per se. But it also seems that fragmentation happens when memory is low (in this case, 38MB or less).
Results from drupal_load() with APC using 30 MB
Total is 700 ms.
aggregator: 10.35, total: 10.35
block: 5.21, total: 15.56
book: 6.42, total: 21.98
comment: 13.48, total: 35.46
filter: 10, total: 45.46
forum: 7.97, total: 53.43
help: 1.13, total: 54.56
menu: 5.18, total: 59.74
node: 19.82, total: 79.56
path: 2.57, total: 82.13
profile: 6.5, total: 88.63
search: 7.31, total: 95.94
system: 15.87, total: 111.81
taxonomy: 10.4, total: 122.21
upload: 6.27, total: 128.48
user: 20.93, total: 149.41
watchdog: 2.09, total: 151.5
akismet: 10.77, total: 162.27
[...]: 0.86, total: 163.13
calendar: 13.3, total: 176.43
calendar_ical: 3.31, total: 179.74
content: 6.82, total: 186.56
nodereference: 3.56, total: 190.12
number: 2.67, total: 192.79
optionwidgets: 1.41, total: 194.2
text: 2.43, total: 196.63
date: 14.67, total: 211.3
date_api: 0.67, total: 211.97
googleanalytics: 1.37, total: 213.34
image_attach: 2.71, total: 216.05
image_gallery: 3.38, total: 219.43
image: 6.82, total: 226.25
img_assist: 11.72, total: 237.97
link: 3.51, total: 241.48
panels: 5.82, total: 247.3
pathauto: 11.4, total: 258.7
persistent_login: 2.78, total: 261.48
blockcache: 2.35, total: 263.83
custom_breadcrumbs: 1.74, total: 265.57
[...]: 4.54, total: 270.11
ed_readmore: 1.51, total: 271.62
feedback: 3.81, total: 275.43
fivestar: 4.38, total: 279.81
flatforum: 0.81, total: 280.62
front_page: 2.75, total: 283.37
imagecache: 5.38, total: 288.75
imagecache_profiles: 0.8, total: 289.55
imagefield: 4.49, total: 294.04
imce: 8.74, total: 302.78
[...]: 5.32, total: 308.1
location_views: 6.95, total: 315.05
location: 84.15, total: 399.2
logintoboggan: 6.05, total: 405.25
menutrails: 1.86, total: 407.11
mail_edit: 1.8, total: 408.91
privatemsg: 18.84, total: 427.75
scheduler: 2.37, total: 430.12
search404: 135.56, total: 565.68
service_links: 3.56, total: 569.24
subscriptions: 8.72, total: 577.96
thickbox: 1.7, total: 579.66
timeline: 12.29, total: 591.95
views_alpha_pager: 2.07, total: 594.02
views_bookmark: 6.43, total: 600.45
views_filterblock: 27.55, total: 628
votingapi: 3.39, total: 631.39
simplemenu: 1.67, total: 633.06
tagadelic: 3.37, total: 636.43
tinymce: 11, total: 647.43
views_rss: 1.82, total: 649.25
views_theme_wizard: 6.23, total: 655.48
views_ui: 14.82, total: 670.3
views_bonus_grid: 1.04, total: 671.34
views_bonus_tag_cloud: 0.62, total: 671.96
auto_nodetitle: 1.17, total: 673.13
fieldgroup: 4.06, total: 677.19
token: 1.13, total: 678.32
views: 13.09, total: 691.41
devel: 9.72, total: 701.13
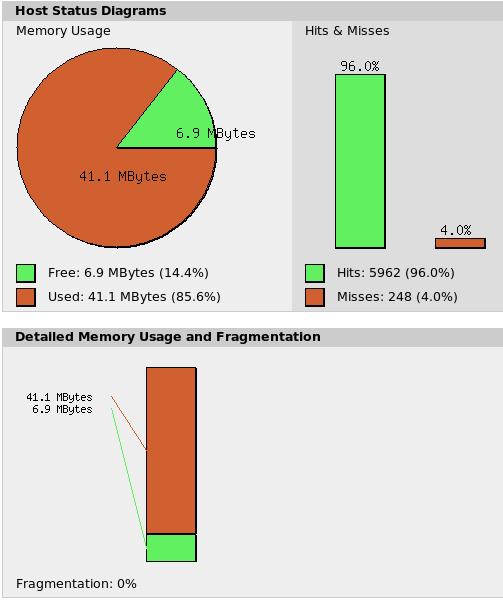
Results from drupal_load() with APC using 48MB
Total is 38 ms, vast improvement.
aggregator: 0.26, total: 0.26
block: 0.13, total: 0.39
book: 0.15, total: 0.54
comment: 0.27, total: 0.81
filter: 0.19, total: 1
forum: 0.2, total: 1.2
help: 0.07, total: 1.27
menu: 0.09, total: 1.36
node: 0.33, total: 1.69
path: 0.08, total: 1.77
profile: 0.17, total: 1.94
search: 0.2, total: 2.14
system: 0.21, total: 2.35
taxonomy: 0.29, total: 2.64
upload: 0.15, total: 2.79
user: 0.54, total: 3.33
watchdog: 0.1, total: 3.43
akismet: 0.28, total: 3.71
[...]: 0.07, total: 3.78
calendar: 0.15, total: 3.93
calendar_ical: 0.09, total: 4.02
content: 0.12, total: 4.14
nodereference: 0.08, total: 4.22
number: 0.07, total: 4.29
optionwidgets: 0.06, total: 4.35
text: 0.07, total: 4.42
date: 0.24, total: 4.66
date_api: 0.14, total: 4.8
googleanalytics: 0.07, total: 4.87
image_attach: 0.1, total: 4.97
image_gallery: 0.12, total: 5.09
image: 0.17, total: 5.26
img_assist: 0.22, total: 5.48
link: 0.1, total: 5.58
panels: 0.12, total: 5.7
pathauto: 0.38, total: 6.08
persistent_login: 0.16, total: 6.24
blockcache: 0.12, total: 6.36
custom_breadcrumbs: 0.09, total: 6.45
[...]: 0.1, total: 6.55
ed_readmore: 0.09, total: 6.64
feedback: 0.11, total: 6.75
fivestar: 0.1, total: 6.85
flatforum: 0.08, total: 6.93
front_page: 0.07, total: 7
imagecache: 0.11, total: 7.11
imagecache_profiles: 0.17, total: 7.28
imagefield: 0.22, total: 7.5
imce: 0.29, total: 7.79
[...]: 1.27, total: 9.06
location_views: 0.24, total: 9.3
location: 20.82, total: 30.12
logintoboggan: 0.22, total: 30.34
menutrails: 0.15, total: 30.49
mail_edit: 0.16, total: 30.65
privatemsg: 0.41, total: 31.06
scheduler: 0.15, total: 31.21
search404: 0.14, total: 31.35
service_links: 0.16, total: 31.51
subscriptions: 0.24, total: 31.75
thickbox: 0.15, total: 31.9
timeline: 0.72, total: 32.62
views_alpha_pager: 0.19, total: 32.81
views_bookmark: 0.21, total: 33.02
views_filterblock: 2.42, total: 35.44
votingapi: 0.19, total: 35.63
simplemenu: 0.14, total: 35.77
tagadelic: 0.19, total: 35.96
tinymce: 0.17, total: 36.13
views_rss: 0.13, total: 36.26
views_theme_wizard: 0.2, total: 36.46
views_ui: 0.25, total: 36.71
views_bonus_grid: 0.13, total: 36.84
views_bonus_tag_cloud: 0.13, total: 36.97
auto_nodetitle: 0.14, total: 37.11
fieldgroup: 0.16, total: 37.27
token: 0.16, total: 37.43
views: 0.44, total: 37.87
devel: 0.32, total: 38.19
Screenshots of apc.php
The following screenshots are taken during the tests. They show that what really hurts is fragmentation.
APC, default settings (i.e. 30 MB shm_size). Note the fragmentation.
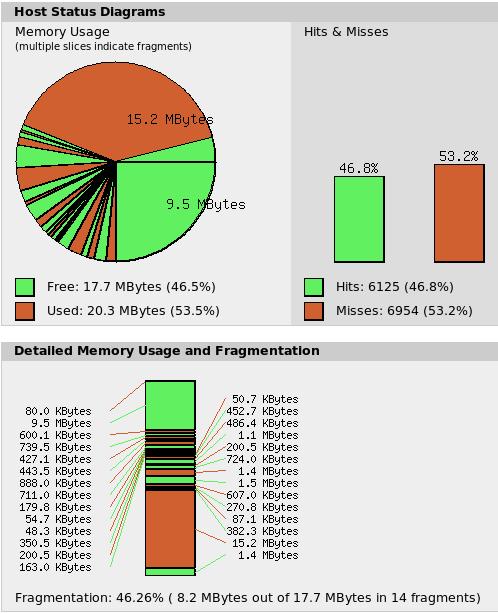
APC, shm_size set to 38. Fragmentation changes from one page to the other, but page time is always 800 ms to 1000 ms.
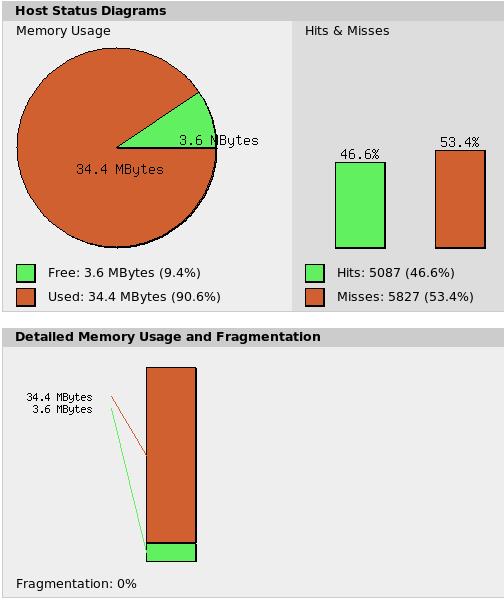
APC with 38MB, as above, but shows fragmentation. Performance is poor.
APC, shm_size set to 48. No fragmentation and page loading time is in the low 200s.
Other links
A blog post about APC memory fragmentation caused by the default shmmax parameter not being enough.


Comments
Jared (not verified)
Thanks!
Mon, 2011/08/01 - 11:17This is exactly what I was looking for. I was having APC issues as well and luckily landed on this page. Cutting down on the number of modules that I was loading helped too..
cam8001 (not verified)
Thanks!
Sat, 2011/09/03 - 07:25I knew APC had a memory allocation issue that was bogging down my pages, but was dreading debugging it to figure out why it was happening. This post explains everything perfectly.
Luis Aveiga (not verified)
THANKS!
Fri, 2012/01/06 - 03:45Just want to thank you! I knew something similar must be happening because when I installed more modules Drupal became slow suddenly... but you answer gave me the solution I can't find myself.
You saved my life :) thanks A LOT!
brunorios (not verified)
My server is a ubuntu 11.10
Sat, 2012/08/04 - 13:16My server is a ubuntu 11.10 in a VMWare Player Guest (20gb hd/1gb ram) and Windows 7 Host.
I installed APC and configured the memory to 256MB
Then i came to this article, found the drupal_load hacked function and copy to my bootstrap.inc...
aaand: total: 3446.9
=O
what can i do???
Teo (not verified)
Dead
Fri, 2013/04/26 - 13:22Dead link
http://t3.dotgnu.info/blog/php/include_once-mostly-harmless.html
Khalid
Fixed
Tue, 2013/04/30 - 10:05Found it at another site, should be fixed now.
Adam (not verified)
RE: 3000ms Page Execution
Sat, 2015/05/23 - 08:20Hi Khalid, salutations to you coder friend!
I have known about this wonderful guide you written here for many years and have always followed it to the letter in all my drupal 6 and 7, knowing fully that it has given me personally great facility and great performance in getting my memcached configuration and APC config up to scratch. Keeping my page loads between 10ms-400ms, normally.
I'd like to share an unusual case I have run into, and it is being shared with desperation in me more than anything; the APC has got my total load down to just a few ms! This is great! Also memcache keeps my queries under 300ms, I applied your module load time script too to bootstrap.inc and everything looks OK, at least when compared to the page execution time given by devel being a whopping 5000ms+! As obviously if you add the devel sql query times to the module load times there's still thousands of ms coming from somewhere. What could this be? Well I've tested it in firefox network analyser and its "/" the main HTML document that is taking 3000-8000ms! arghh no! It's driving me absolutely bonkers! What could cause this high execution time? I've even setup a local high performance machine, also to no avail. The same old sorry story :(
Even following this excellent guide and the great advice, by confirming and reducing module load time and preventing fragmentation of APC, I cannot understand why a 15MB PHP page could ever possibly take so long to execute! Especially after analyzing the sql load times and module load times with your excellent bootstrap.inc modification and adding them! Where is the extra time coming from I am thinking!?
I tried using a very high speed dedicated server thinking it might be the environment and to my surprise I observe and recreate exactly the same problem as I did on my shared hosting. So I'm certain it's something in drupal causing this which is both not modules or query execution time. What else could it possibly be?
Is there a way to look at what is going on further? I'm using a theme, which is very heavy, but surely it can't be that, can it?
I am sure this is quite an interesting case both to you and other users. Rare, perhaps but so frustrating. Please would you be able to offer some advice as to how I might be able to analyse this problem further? Before I bang my head into the wall reducing it into tiny pieces !
Thank you!
Best Wishes,
Adam
Khalid
Could be many things ...
Sun, 2015/05/24 - 18:25It could be many things.
The usual suspects are:
a) Network time: Something is doing a network call to a server that is slow.
b) Views: which sometimes does not report its query execution and output rendering time to devel.
The only sure way is to do code profiling. Use xhprof to do that and it will pin point where the time is longest.
Adam (not verified)
RE: 3000ms Page Execution, Xhprof
Wed, 2015/05/27 - 19:08Dear Khalid,
Firstly, please accept my humble apologies for the delay in responding to you. I can report that I have installed xhprof and run it with the d7 devel module. Other than the fact that it also now reports page load times that take a whopping and rather embarrassing 10,000ms - as after all this is my own website! It seems to indicate very well what the problem is, and it seems to be with the theme if I interpret correctly the trace which I have followed:
Please note that it is a stock drupal7 installation with only a theme and 10 modules installed.
main -> wall time 9,966,290microseconds
menu_execute_active_handler -> wall time 9,925,756
drupal_deliver_html_page -> 9,820,706
drupal_render_page -> 7,536,349
theme-> 7,536,257
superhero_preprocess_page - > 7,194,229
superhero_scss::outputFile -> 7,120,517
scss:compile 7,120,491
scss:compilechildren 6,817,552
scss:compileimport 6,816,925
scssc::importFile 6,813,916
scss_parser::parse 6,057,685
scss_parser::parseChunk 6,048,838
scss_parser::valueList 3,112,633
scss_parser::selectors 1,203,445
scss_parser::literal 531,843
(more scss_parser calls not included)
(Main offender: 3rdpartytheme/includes/scss.inc.php)
The problem appears to resolve around this scss outputfile, which is of course the well known SCSS SASS Tool set used for compiling CSS at runtime in PHP scripts. What I find absolutely amazing, it being a 3rd party 'responsive' theme written by someone else is that it's use of SCSS seems to be outrageously high. Furthermore, if I understand the way the script should run, it should NOT compile the CSS each time, yet, although it does not make the file if it exists, it does however seem to parse it all repeatedly! Slowing down the site absolutely no end!
Unfortunately only being an average to lower than average capability I was not able to resolve the problem with the theme myself sadly. However, it seems that the theme does however use SCSS heavily to allow changes to be made to the CSS. There was 1,000,000 function calls! Which to me seems a little excessive!
For thoroughness and to show fully the problems for others that may experience this issue or similar ones like it:
XHPROF Overall Summary
Total Incl. Wall Time (microsec): 9,966,290 microsecs
Total Incl. CPU (microsecs): 3,968,396 microsecs
Total Incl. MemUse (bytes): 16,178,940 bytes
Total Incl. PeakMemUse (bytes): 21,983,236 bytes
Number of Function Calls: 1,013,469
Khalid's Module Time Details:
dblog: 0.1, total: 0.1
statistics: 0.1, total: 0.2
devel: 0.23, total: 0.43
user: 1.31, total: 1.74
block: 0.21, total: 1.95
block_class: 0.07, total: 2.02
ckeditor: 0.22, total: 2.24
color: 0.1, total: 2.34
comment: 0.26, total: 2.6
contact: 0.08, total: 2.68
context: 0.21, total: 2.89
contextual: 0.07, total: 2.96
context_layouts: 0.08, total: 3.04
context_ui: 0.09, total: 3.13
ctools: 0.15, total: 3.28
dashboard: 0.11, total: 3.39
delta: 0.1, total: 3.49
delta_ui: 0.07, total: 3.56
entity: 0.49, total: 4.05
entityreference: 0.17, total: 4.22
exclude_node_title: 0.09, total: 4.31
field: 0.67, total: 4.98
field_sql_storage: 0.11, total: 5.09
field_ui: 0.09, total: 5.18
file: 0.19, total: 5.37
file_entity: 0.23, total: 5.6
filter: 0.14, total: 5.74
help: 0.07, total: 5.81
image: 0.26, total: 6.07
imce: 0.09, total: 6.16
jquery_update: 0.09, total: 6.25
libraries: 0.09, total: 6.34
lightbox2: 0.1, total: 6.44
link: 0.2, total: 6.64
list: 0.1, total: 6.74
md_slider: 0.36, total: 7.1
media: 0.46, total: 7.56
memcache: 0.07, total: 7.63
memcache_admin: 0.1, total: 7.73
menu: 0.12, total: 7.85
newsletter: 0.15, total: 8
node: 0.34, total: 8.34
number: 0.11, total: 8.45
options: 0.09, total: 8.54
path: 0.08, total: 8.62
rdf: 0.14, total: 8.76
responsive_slideshow: 0.13, total: 8.89
search: 0.15, total: 9.04
shortcode: 0.32, total: 9.36
shortcut: 0.13, total: 9.49
sp_twitter: 0.09, total: 9.58
superhero_block: 0.11, total: 9.69
superhero_blog: 0.08, total: 9.77
superhero_breadcrumb: 0.08, total: 9.85
superhero_display: 0.07, total: 9.92
superhero_dropdown: 0.08, total: 10
superhero_portfolio: 0.12, total: 10.12
superhero_quicksettings: 0.07, total: 10.19
superhero_shortcode: 1.31, total: 11.5
superhero_theme: 0.08, total: 11.58
system: 0.26, total: 11.84
taxonomy: 0.21, total: 12.05
text: 0.12, total: 12.17
token: 0.17, total: 12.34
update: 0.16, total: 12.5
views_ui: 0.11, total: 12.61
pathauto: 0.15, total: 12.76
views: 0.3, total: 13.06
admin_menu: 0.11, total: 13.17
wilson: 0.09, total: 13.26
SQL Time:
Executed 232 queries in 503.24 ms. Page execution time was 9276.66 ms. XHProf output. Memory used at: devel_boot()=0.77 MB, devel_shutdown()=12.05 MB, PHP peak=20.25 MB.
As can be seen other than some problems with SQL Time which could be fixed by some sql tuning, the modules run very lean. It's a shame that it's not something I've done personally to cause it other than the theme I've used utilizing scss like a ravenous beast!
Anyway, this about summarizes the problems I think I was having, and I hope that this can help other people with the same problems.
Thanks for all your help Khalid. I appreciate it significantly and it was very good of you to help me with my problem without asking for anything in return, other than my sincere and absolute thanks!
Best Wishes,
Adam
Pages