A very large site we manage for a client was upgraded recently from the memcache module version 1.12 to version 1.13.
However, the result was less performance for this server that was humming alone happily with the older version.
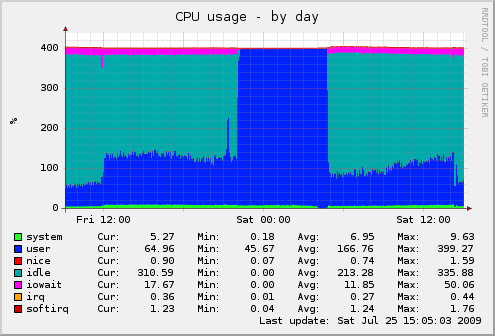
The Munin graphs tell it all: look at the change at 12:00 noon.
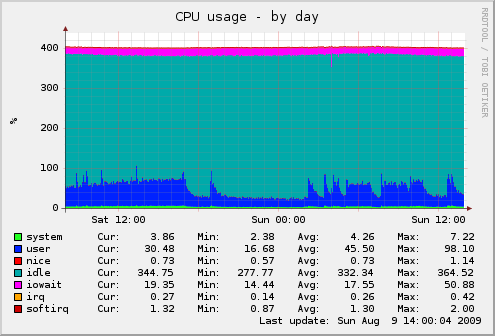
Here is the CPU graph, showing double the CPU utilization on this sever.
(Ignore the 100% CPU utilization 10 pm, which is due to taxonomy browser scalability and solution.)
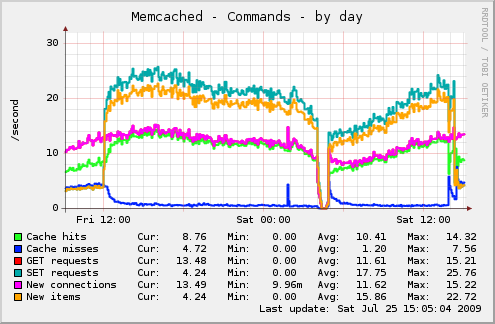
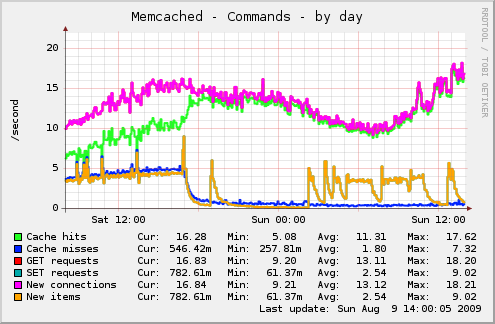
You can see how memcache's Munin graph for the cache_page bin: notice the spike in SET requests and New items. Also interesting is that the cache misses are less!
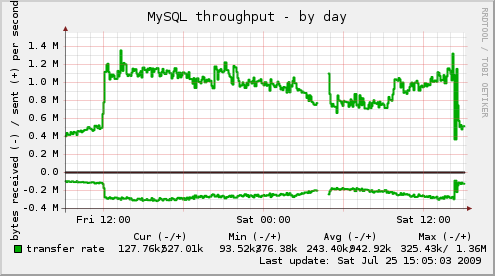
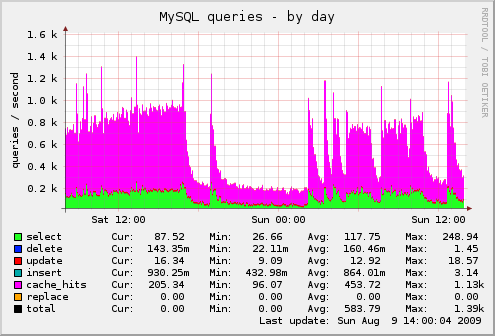
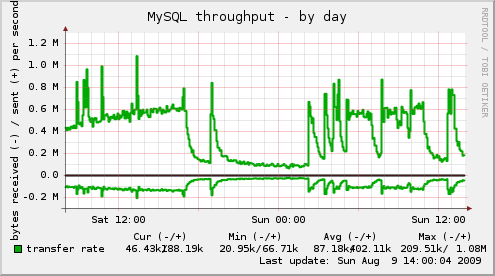
Of course, the load on MySQL climbed up too: instead of 0.4 to 0.5 MBps, it is now up to 1.2 MBps.
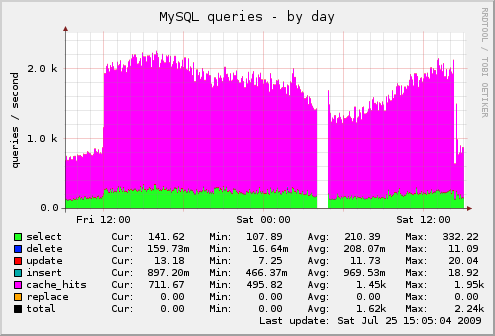
And the total number of queries jumps from 800 or so questions per second to 2000 or more.
The configuration for both cases was identical, using the plain memcache.inc, and not the db variant, and 15 minutes for the cache lifetime:
$conf = array(
  'cache_inc' => './sites/all/modules/memcache/memcache.inc',

  'memcache_servers' => array(
    '127.0.0.1:11211' => 'page',
    '127.0.0.1:11212' => 'filter',
    '127.0.0.1:11213' => 'default',
  ),

  'memcache_bins' => array(
    'cache_page'    => 'page',
    'cache_filter'  => 'filter',
    'cache'         => 'default',
    'cache_menu'    => 'default',
    'cache_block'   => 'default',
    'cache_form'    => 'default',
    'cache_content' => 'default',
    'cache_update'  => 'default',
    'cache_views'   => 'default',
  ),
);
The page bin has 384MB as a maximum for it, and normally will not use it all.
Reverting back the older version resolved this for the time being. See the end of the graphs, things are back to normal.
A patch for the changes from 1.2 to 1.3 is attached if it makes it easier for others to inspect them.
Have you seen something similar?
Update
Thanks to Jeremy's quick response, the issue is now fixed in 6.x-1.4-rc1.
The new version shows a positive trend on the server:
Here is the CPU graph
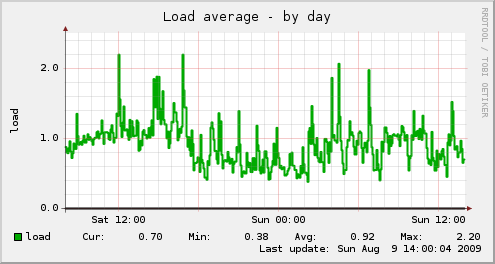
Here is the Load Average for the server
Here is the Memcache statistics
The MySQL queries
And MySQL bytes
| Attachment | Size |
|---|---|
| 7.27 KB |


Comments
Visitor (not verified)
Report a bug
Tue, 2009/07/28 - 07:30I think the most constructive thing to do would be to create a (critical) bug report for the memcache module, and to put a link to that issue in this post. A blog's comments isn't the best place to debug an issue like this.
Khalid
You are right
Tue, 2009/07/28 - 12:24I was going to do this initially, but decided against it until I get feedback that it is really a problem.
Anyway, I did that now at #533524.
Visitor (not verified)
Fixed?
Tue, 2009/08/04 - 15:12I just posted a patch to another issue which I believe will fix the issue you ran into:
http://drupal.org/node/539108
Visitor (not verified)
Munin plugin
Mon, 2009/08/17 - 06:30As you i've tested to trace Memcached with Munin.
But script i've downloaded does work.
Can we have access to your script?
Thanks a lot
Visitor (not verified)
Munin's Memcached plugin
Wed, 2009/08/19 - 01:25OK i found a solution.
Plugin works but his installation isn't very clear.
Script home page :
http://munin.projects.linpro.no/wiki/plugin-memcache
Take second generation one here :
http://munin.projects.linpro.no/attachment/wiki/plugin-memcache/memcached_
To make it works correctly you must have memcached for Perl :
apt-get install libcache-memcached-perl
Place this script in Munin plugins directory
/etc/munin/plugins/memcached_
And you must create symbolik links to this script :
ln -s /etc/munin/plugins/memcached_ /etc/munin/plugins/memcached_rates
ln -s /etc/munin/plugins/memcached_ /etc/munin/plugins/memcached_bytes
ln -s /etc/munin/plugins/memcached_ /etc/munin/plugins/memcached_counters
Now you have 3 new graphs in Munin for Memcached.