We discussed the topic of the open buffet binge syndrome, where web sites "gorge" on contributed modules, and cause site performance to be slow and memory utilization to be high.
We encountered an interesting case recently while doing work for a client. The main symptom was page execution time that is high (800 to 1200 ms), but database query time that is low.
The normal case is where the total page execution time is high, and
a significant portion of that is due to database queries. Using the
devel module we can identify those and work on tuning the module, or
the database to squeeze more performance.
In this case, it was the other way around. For example:
Executed 175 queries in 43.46 milliseconds. Page execution time was 1150.73 ms.
Why would queries take only 43 ms, yet the whole page execution is 1150 ms? Where are the 1107 ms spent? This is too high.
So, in order to troubleshoot this we replicated the site to our test servers, and proceeded to investigate. Our test server runs APC, so PHP time should not be high at all.
Using xdebug and kcachegrind, we narrowed down the problem to the drupal_load() function, where most of the time was spent.
Seeing that this function does include_once() for every module, that was the place to investigate.
Measuring include_once
First we changed the drupal_load() function to look like this:
function drupal_load($type, $name) {
static $files = array(), $total_time = 0;
if (isset($files[$type][$name])) {
return TRUE;
}
$timer_id = 'include ' . $name;
timer_start($timer_id);
$filename = drupal_get_filename($type, $name);
if ($filename) {
include_once "./$filename";
$time = timer_read($timer_id);
$total_time += $time;
print "$name: $time, total: $total_time\n";
$files[$type][$name] = TRUE;
return TRUE;
}
return FALSE;
}
This does not change the behavior, but gives us back the time required to load each module using the include_once() function, as well as a running total.
The output, using APC, looked like this (some module names obscured so as not to identify the web site in public):
0.63 date_api
0.64 views_bonus_tag_cloud
0.71 imagecache_profiles
0.75 flatforum
0.85 [censored]
1.01 views_bonus_grid
1.08 help
1.11 token
1.12 auto_nodetitle
1.21 googleanalytics
1.28 optionwidgets
1.37 ed_readmore
1.41 search404
1.51 thickbox
1.61 custom_breadcrumbs
1.61 simplemenu
1.65 mail_edit
1.74 menutrails
1.92 watchdog
2.16 views_alpha_pager
2.17 blockcache
2.17 text
2.22 scheduler
2.35 front_page
2.42 path
2.47 number
2.5 tagadelic
2.55 persistent_login
2.56 image_attach
2.96 calendar_ical
3.08 image_gallery
3.29 nodereference
3.32 link
3.33 feedback
3.36 service_links
3.37 votingapi
3.91 fieldgroup
4.02 fivestar
4.09 imagefield
4.2 [censored]
4.68 menu
4.74 imagecache
4.79 block
4.93 [censored]
5.25 panels
5.52 logintoboggan
5.73 profile
5.82 upload
5.83 views_theme_wizard
6.07 content
6.21 image
6.45 views_bookmark
6.58 location_views
6.65 search
7.46 tinymce
7.52 forum
7.63 imce
8.24 subscriptions
8.76 filter
9.24 devel
9.29 akismet
9.45 taxonomy
9.54 aggregator
10.27 pathauto
10.36 img_assist
11.66 timeline
11.9 comment
12.01 calendar
12.56 views
12.86 views_ui
12.88 date
13.99 system
16.94 privatemsg
18.32 node
19.38 user
27.09 views_filterblock
79.98 location
172.97 views_rss
174.64 book859.9 Total
Wow! Out of 1150 ms, 860 are spent just loading the modules!
Without APC
So, we disabled APC and got 286.8 ms.
What? no op-code cache/accelerator is better than with APC? Unbelievable ...
APC settings for include_once
Consulting Google's search, it seems that APC has a performance problem with include_once, as mentioned here and here. Versions 3.0.12 and later have a new parameter for improving performance. In a nutshell, this goes like this in your php.ini or apc.ini.
apc.apc.stat = 0
apc.include_once_override = 1
So, we changed APC to have those settings, yet we did not see much difference. Still 800+ ms.
Xcache performance
We then decided to try another op-code cache. We decided to use Xcache, since it is maintained (unlike the best performer, eAccelerator). As a bonus Ubuntu has xcache in the repository, so it can be installed using apt, without the need to built it locally.
The results were very encouraging: total page execution was 288.29 ms, and the drupal_load() was only 66.81 ms.
Example:
Executed 175 queries in 31.03 milliseconds. Page execution time was 288.29 ms.
We now know that APC is indeed the culprit.
Back to APC
But why do the APC settings not improve performance. Something else is at play here.
So, we decided to change APC to use 64 MB of shared memory instead of the default 30 MB. APC uses this memory to cache the parsed and tokenized scripts for later calls. This was done by adding:
apc.shm_size = 64
The results were amazing: total page execution was 253.77 ms, and out of that, only 37.38 ms were from drupal_load()!
Example:
Executed 175 queries in 37.48 milliseconds. Page execution time was 253.77 ms.
This is faster than Xcache, as expected.
No doubt the number of modules uses overflowed the default 30MB, and hence caching was next to useless. Increasing that solved the problem.
What is strange is that removing apc.stat and apc.include_once_override did not seem to have any negative effect on drupal_load()'s performance.
Conclusion
Based on the above tests, we can make the following conclusions:
- We have a happy client, since page generation times are now down from 1150 ms to 254 ms.
- If in doubt, use the apc.php administration front end for APC to know exactly how much of the allocated shared memory you are using.
- Experiment with apc.stat and apc.include_once_override to see if they help in your setup.
- Xcache is a viable option, specially if you find installing APC daunting.
Update
Article updated on Dec 1, 2007.
- The patch to drupal_load() has been modified to print the running total. Output from both cases can be seen below (700 ms vs. 38 ms).
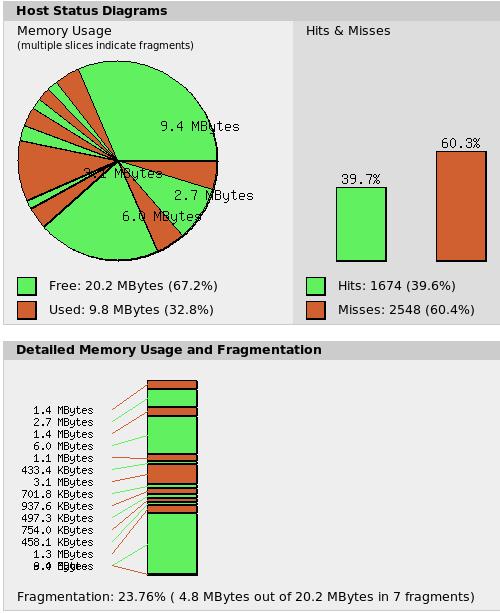
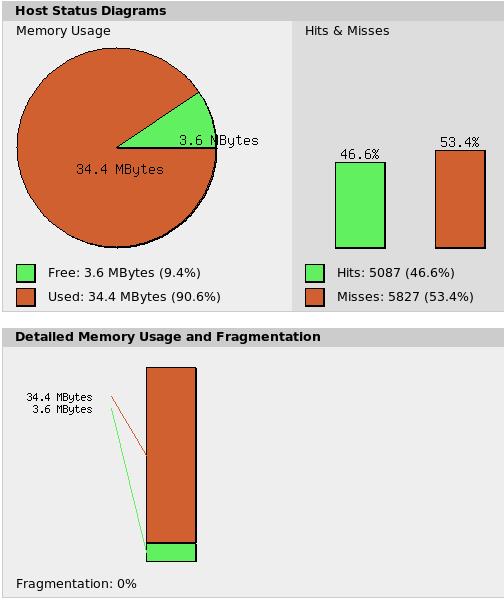
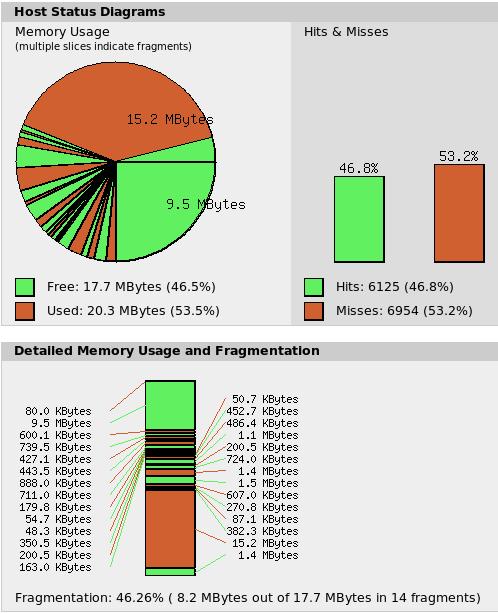
- Below, you will find screenshots from apc.php. Fragmentation is what hurts performance, not the size of memory per se. But it also seems that fragmentation happens when memory is low (in this case, 38MB or less).
Results from drupal_load() with APC using 30 MB
Total is 700 ms.
aggregator: 10.35, total: 10.35
block: 5.21, total: 15.56
book: 6.42, total: 21.98
comment: 13.48, total: 35.46
filter: 10, total: 45.46
forum: 7.97, total: 53.43
help: 1.13, total: 54.56
menu: 5.18, total: 59.74
node: 19.82, total: 79.56
path: 2.57, total: 82.13
profile: 6.5, total: 88.63
search: 7.31, total: 95.94
system: 15.87, total: 111.81
taxonomy: 10.4, total: 122.21
upload: 6.27, total: 128.48
user: 20.93, total: 149.41
watchdog: 2.09, total: 151.5
akismet: 10.77, total: 162.27
[...]: 0.86, total: 163.13
calendar: 13.3, total: 176.43
calendar_ical: 3.31, total: 179.74
content: 6.82, total: 186.56
nodereference: 3.56, total: 190.12
number: 2.67, total: 192.79
optionwidgets: 1.41, total: 194.2
text: 2.43, total: 196.63
date: 14.67, total: 211.3
date_api: 0.67, total: 211.97
googleanalytics: 1.37, total: 213.34
image_attach: 2.71, total: 216.05
image_gallery: 3.38, total: 219.43
image: 6.82, total: 226.25
img_assist: 11.72, total: 237.97
link: 3.51, total: 241.48
panels: 5.82, total: 247.3
pathauto: 11.4, total: 258.7
persistent_login: 2.78, total: 261.48
blockcache: 2.35, total: 263.83
custom_breadcrumbs: 1.74, total: 265.57
[...]: 4.54, total: 270.11
ed_readmore: 1.51, total: 271.62
feedback: 3.81, total: 275.43
fivestar: 4.38, total: 279.81
flatforum: 0.81, total: 280.62
front_page: 2.75, total: 283.37
imagecache: 5.38, total: 288.75
imagecache_profiles: 0.8, total: 289.55
imagefield: 4.49, total: 294.04
imce: 8.74, total: 302.78
[...]: 5.32, total: 308.1
location_views: 6.95, total: 315.05
location: 84.15, total: 399.2
logintoboggan: 6.05, total: 405.25
menutrails: 1.86, total: 407.11
mail_edit: 1.8, total: 408.91
privatemsg: 18.84, total: 427.75
scheduler: 2.37, total: 430.12
search404: 135.56, total: 565.68
service_links: 3.56, total: 569.24
subscriptions: 8.72, total: 577.96
thickbox: 1.7, total: 579.66
timeline: 12.29, total: 591.95
views_alpha_pager: 2.07, total: 594.02
views_bookmark: 6.43, total: 600.45
views_filterblock: 27.55, total: 628
votingapi: 3.39, total: 631.39
simplemenu: 1.67, total: 633.06
tagadelic: 3.37, total: 636.43
tinymce: 11, total: 647.43
views_rss: 1.82, total: 649.25
views_theme_wizard: 6.23, total: 655.48
views_ui: 14.82, total: 670.3
views_bonus_grid: 1.04, total: 671.34
views_bonus_tag_cloud: 0.62, total: 671.96
auto_nodetitle: 1.17, total: 673.13
fieldgroup: 4.06, total: 677.19
token: 1.13, total: 678.32
views: 13.09, total: 691.41
devel: 9.72, total: 701.13
Results from drupal_load() with APC using 48MB
Total is 38 ms, vast improvement.
aggregator: 0.26, total: 0.26
block: 0.13, total: 0.39
book: 0.15, total: 0.54
comment: 0.27, total: 0.81
filter: 0.19, total: 1
forum: 0.2, total: 1.2
help: 0.07, total: 1.27
menu: 0.09, total: 1.36
node: 0.33, total: 1.69
path: 0.08, total: 1.77
profile: 0.17, total: 1.94
search: 0.2, total: 2.14
system: 0.21, total: 2.35
taxonomy: 0.29, total: 2.64
upload: 0.15, total: 2.79
user: 0.54, total: 3.33
watchdog: 0.1, total: 3.43
akismet: 0.28, total: 3.71
[...]: 0.07, total: 3.78
calendar: 0.15, total: 3.93
calendar_ical: 0.09, total: 4.02
content: 0.12, total: 4.14
nodereference: 0.08, total: 4.22
number: 0.07, total: 4.29
optionwidgets: 0.06, total: 4.35
text: 0.07, total: 4.42
date: 0.24, total: 4.66
date_api: 0.14, total: 4.8
googleanalytics: 0.07, total: 4.87
image_attach: 0.1, total: 4.97
image_gallery: 0.12, total: 5.09
image: 0.17, total: 5.26
img_assist: 0.22, total: 5.48
link: 0.1, total: 5.58
panels: 0.12, total: 5.7
pathauto: 0.38, total: 6.08
persistent_login: 0.16, total: 6.24
blockcache: 0.12, total: 6.36
custom_breadcrumbs: 0.09, total: 6.45
[...]: 0.1, total: 6.55
ed_readmore: 0.09, total: 6.64
feedback: 0.11, total: 6.75
fivestar: 0.1, total: 6.85
flatforum: 0.08, total: 6.93
front_page: 0.07, total: 7
imagecache: 0.11, total: 7.11
imagecache_profiles: 0.17, total: 7.28
imagefield: 0.22, total: 7.5
imce: 0.29, total: 7.79
[...]: 1.27, total: 9.06
location_views: 0.24, total: 9.3
location: 20.82, total: 30.12
logintoboggan: 0.22, total: 30.34
menutrails: 0.15, total: 30.49
mail_edit: 0.16, total: 30.65
privatemsg: 0.41, total: 31.06
scheduler: 0.15, total: 31.21
search404: 0.14, total: 31.35
service_links: 0.16, total: 31.51
subscriptions: 0.24, total: 31.75
thickbox: 0.15, total: 31.9
timeline: 0.72, total: 32.62
views_alpha_pager: 0.19, total: 32.81
views_bookmark: 0.21, total: 33.02
views_filterblock: 2.42, total: 35.44
votingapi: 0.19, total: 35.63
simplemenu: 0.14, total: 35.77
tagadelic: 0.19, total: 35.96
tinymce: 0.17, total: 36.13
views_rss: 0.13, total: 36.26
views_theme_wizard: 0.2, total: 36.46
views_ui: 0.25, total: 36.71
views_bonus_grid: 0.13, total: 36.84
views_bonus_tag_cloud: 0.13, total: 36.97
auto_nodetitle: 0.14, total: 37.11
fieldgroup: 0.16, total: 37.27
token: 0.16, total: 37.43
views: 0.44, total: 37.87
devel: 0.32, total: 38.19
Screenshots of apc.php
The following screenshots are taken during the tests. They show that what really hurts is fragmentation.
APC, default settings (i.e. 30 MB shm_size). Note the fragmentation.
APC, shm_size set to 38. Fragmentation changes from one page to the other, but page time is always 800 ms to 1000 ms.
APC with 38MB, as above, but shows fragmentation. Performance is poor.
APC, shm_size set to 48. No fragmentation and page loading time is in the low 200s.
Other links
A blog post about APC memory fragmentation caused by the default shmmax parameter not being enough.


Comments
Khalid
Probably without accelerator
Mon, 2009/01/26 - 14:33Those are indeed very significant numbers.
I assume you are not using an accelerator (e.g. APC, eAccelerator, XCache, ...etc.) The numbers are always inflated when you do not use one. Less so when you have one enabled.
Visitor (not verified)
Actually, yes, I am using
Mon, 2009/01/26 - 14:50Actually, yes, I am using APC. Without, they're even worse (2000+ ms).
Visitor (not verified)
apc.stat = 0
Wed, 2009/06/17 - 21:01Be careful with apc.stat = 0. It is really only appropriate in very specific circumstances, i.e. if your scripts NEVER change.
apc.stat controls whether or not APC checks if a file has been updated in the filesystem, and it will cause your server to always* serve the cached version of scripts, even if you change the code. Not good on a development server, for sure.
* until APC is restarted, the web server is restarted, or the file gets otherwise dirtied from the cache by chance.
Visitor (not verified)
My problem is different: I do
Mon, 2009/10/26 - 11:17My problem is different: I do indeed notice the improvements in speed, but since I have 4 servers serving the same site, I run into stale content from time to time, and the only way of cleaning it fast is reloading apache (or hit all the tabs on the apc.php page and clean each bin...
Visitor (not verified)
APC memory settings
Thu, 2009/10/29 - 08:52According to this:
http://www.debian-administration.org/articles/574
PHP manual says apc.shm_size should be the same as Linux shared memory segment settings:
cat /proc/sys/kernel/shmmaxSo it would probably be sensible to change your Linux memory usage settings to match what you're telling APC too? I believe this would do it in CentOS:
sysctl kernel.shmmax=67108864Visitor (not verified)
disk memory
Sun, 2009/11/08 - 09:41Seems apc may be using mmapped memory on disk rather than RAM - see http://drupal.org/node/415348
Visitor (not verified)
Memory filling up
Fri, 2009/10/30 - 14:01Hello,
I've set up APC on my site and allocated 64MB for it - with really good results as far as speeding up my site. I am, however, watching the memory slowly filling up and am wondering what happens when it tops out. It seems like clearing the cache is counter to why it's set up in the first place, things will just start getting cached again and eventually fill up again anyway. Should I be "filtering" so that I'm not caching certain things? How do I figure out what I should be filtering? Should I be upping my memory allocation? I'm using Drupal 5 and it's a relatively well-trafficked site (which is why I set up APC in the first place). I'm a php programmer, but I have little experience tinkering with server settings, having used shared environments most of my days. This site is on a dedicated server.
Thanks,
Nathan
larowlan (not verified)
Note that the
Mon, 2011/05/16 - 19:15Note that the include_once_override on php 5.3 causes havoc (WSOD) with many common modules, including filefield.
See http://drupal.org/node/807680 for discussions.
Apparently php 5.3 doesn't require this setting anymore, although perhaps a follow up post with new metrics would confirm this? ;-)
Visitor (not verified)
I wish I had done this earlier
Fri, 2011/06/10 - 16:23Dear Khalid,
thanks for this posting. I thought I had everything optimised, yet there was some undefined function in one of the modules which was being called on every load and thus prevented the particular file from caching. I wish I would have noticed earlier, but it was not logged as the warning occured so early :(
Eliminating the problem reduced my loading time from 600 to 60 ms.
me (not verified)
How could you get 60 ms? If a
Tue, 2012/04/10 - 10:44How could you get 60 ms? If a clean Drupal 7.12 core loaded in 222ms. after the APC is 122 ms. It can not get 60ms.! How many modules you have connected?? I would like to know details about your configuration.
Pages