Update 2017-April-20: The information in this article contains a now outdated extension for VIM. In order to use a more current extension, please get vdebug, which works with XDebug.
Original article follows ...
The power and simplicity of some tools is often overlooked or underestimated.
One such tool is good old vim (VI iMproved), a text editor for UNIX systems, also available for other platforms.
This articles describes how vim can be used with the xdebug protocol to provide full debugging capabilities for Drupal (or any PHP application for that matter).
Please note that other IDE's for PHP handle debugging, such as Komodo, and even Quanta Plus for KDE (Linux). However, to have this power from a text interface is very cool to say the least.
Credits
The xdebug interface for vim was written by Seung Woo Shin and is available on vim.org. A slightly modified version with a README file is attached to this article.
Requirements
To use this script, you have to get python 2.3 or higher, and xdebug 2.0 on your system (we will cover the installation an configuration of xdebug in a future article).
Installation
Extract the debugger.py and debugger.vim files and place them in your .vim/plugin directory (create it if it does not exist).
Starting the debugger
Start vim, and hit F5. A message will appear waiting for a debug session to start and attach to your vim instance.Now, browse to the URL of the page causing you grief, and add XDEBUG_SESSION_START to the end of the URL.
For clean URLs use: http://example.com/admin/feature?XDEBUG_SESSION_START=1 Otherwise use: http://example.com?q=admin/feature&XDEBUG_SESSION_START=1
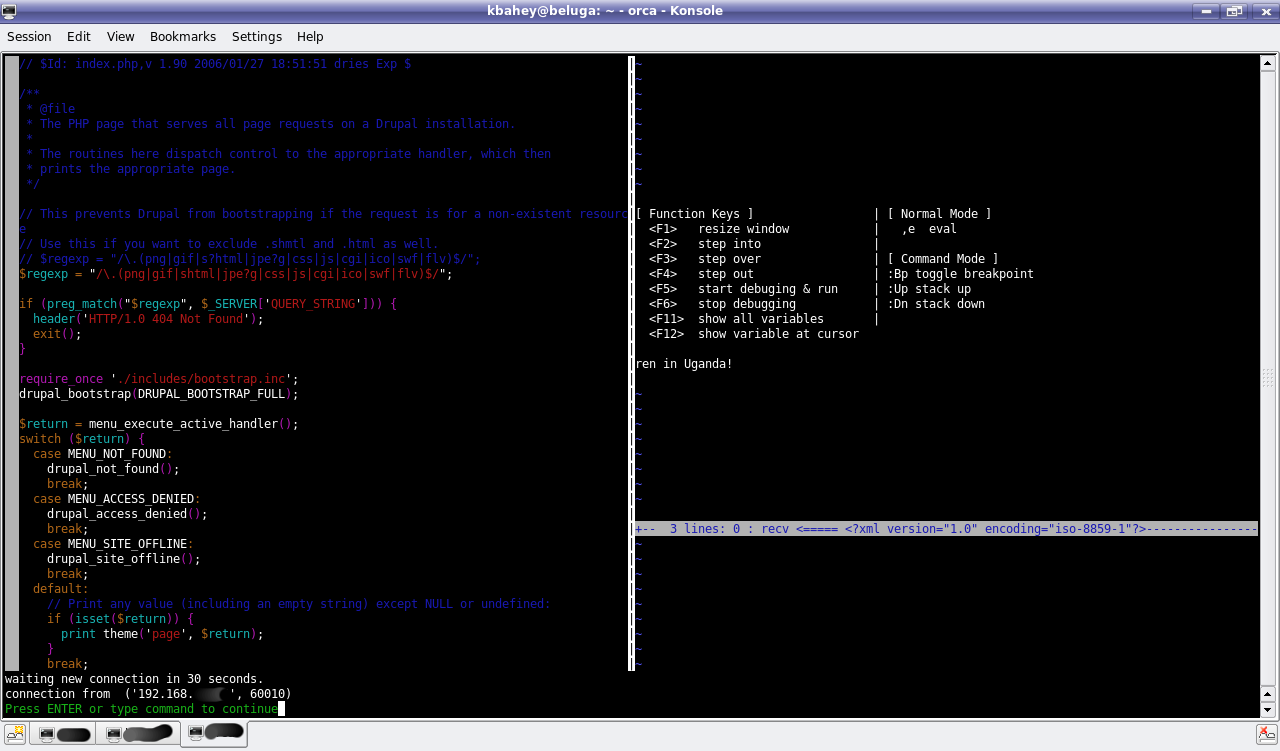
The debugger will start and several windows will appear in vim, with Drupal's index.php showing.
Here is how the start of a debug session looks:
Setting breakpoints
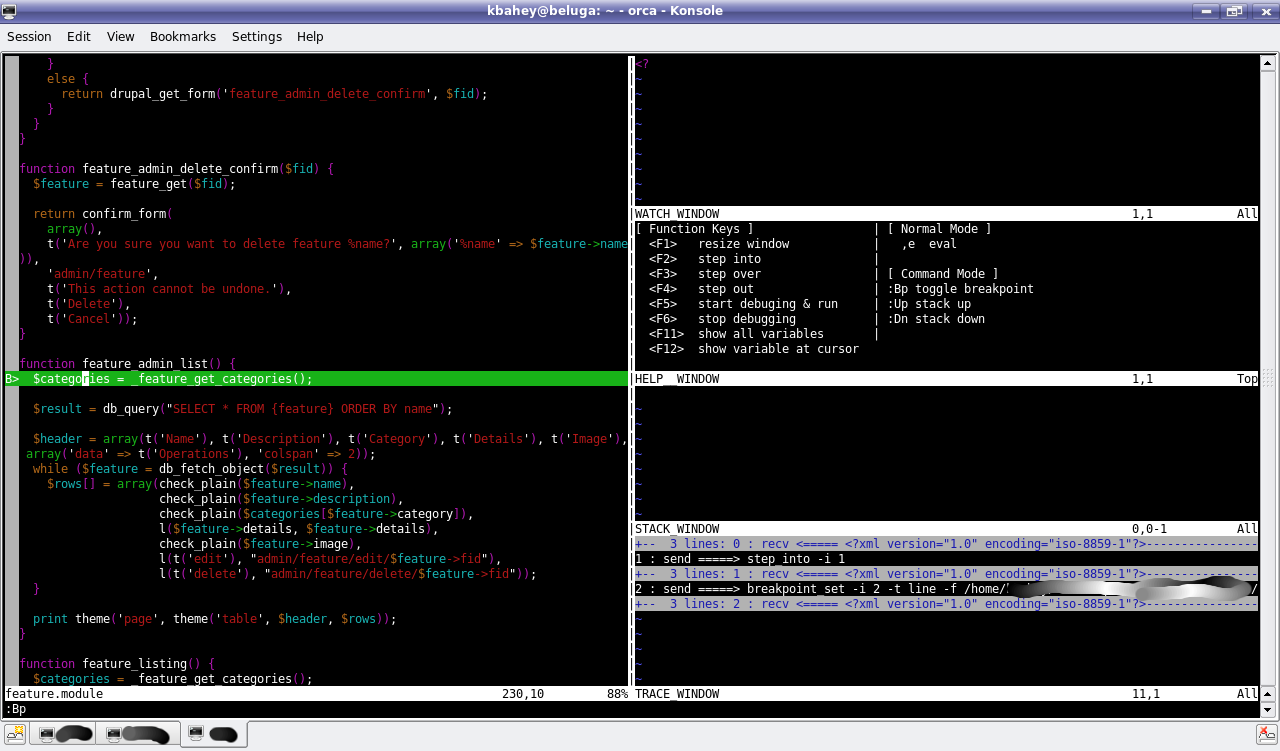
Using the :e command in vim, open the file you are interested in (e.g. feature.module in this case).Go to the function/line you suspect, and set a breakpoint using the :Bp command.
Here is how setting a breakpoint looks like:
Debugging at a breakpoint
Hit F4 to continue until the breakpoint is reached.
Reaching a breakpoints:
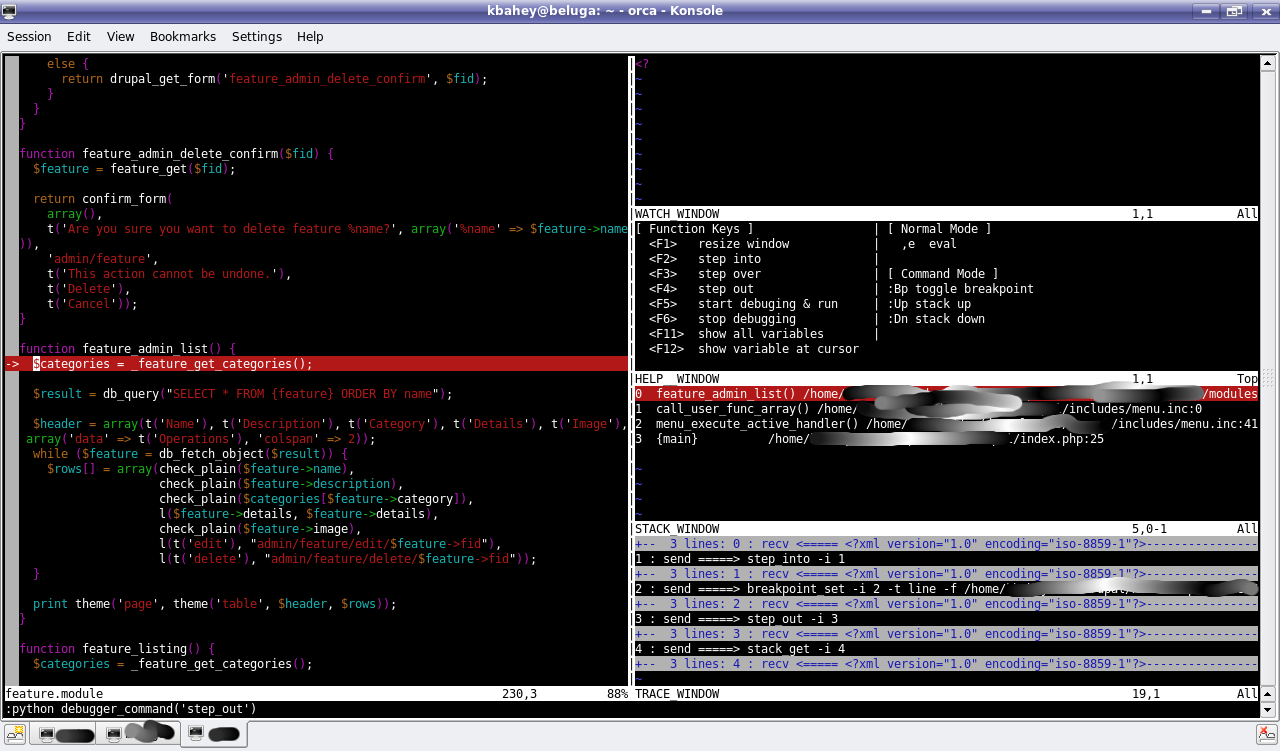
Once at the breakpoint, you can step through the program, display variables, ...etc.
Use the function keys and commands on screen.
Displaying variables
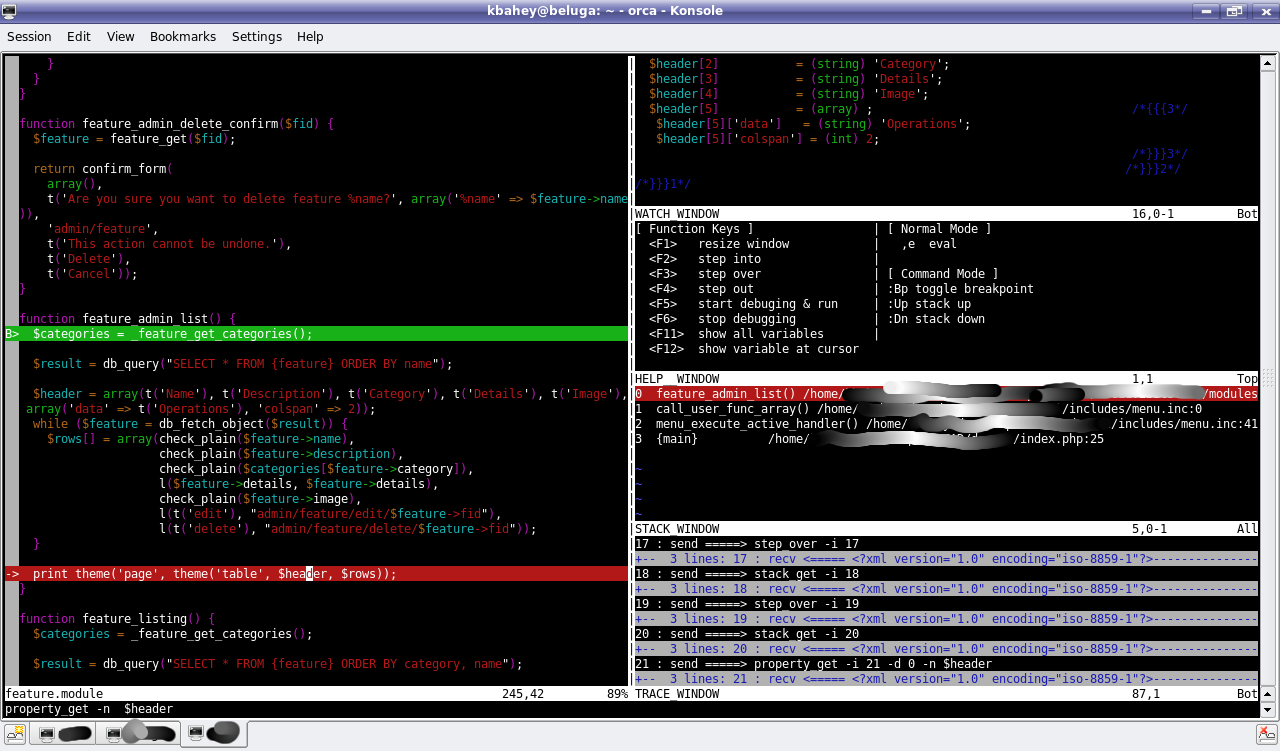
You can move the cursor to any variable, and hit F12 to see what is in this variable.
Displaying a variable:
Evaluating an expression or variable
Use the ,e command to evaluate an expression or print a variable. This is handy in complex variables such as objects and arrays.
Evaluating a variable:
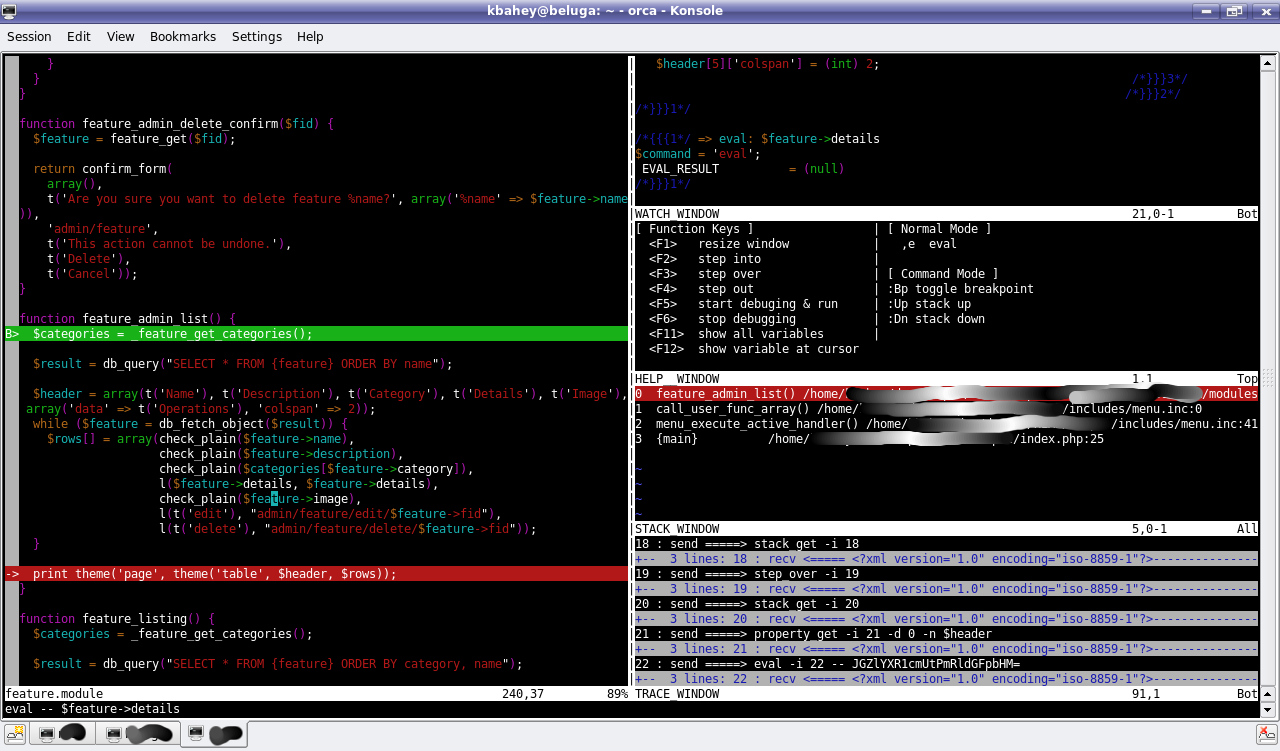
Of course, there are many more uses for this, such as seeing how Drupal handles things, and how elegant its internal architecture is.
Desired functionality
vim xdebug is very powerful yet simple. It is missing only one feature, which is multi-user support. This requires the xdebug proxy to be supported. This allows multiple sessions to connect to the proxy with a different IDE Key (the argument for XDEBUG_SESSION_START).
If someone adds that feature before I do, let me know. I have the setup to test this if needed.
| Attachment | Size |
|---|---|
| 10.77 KB |


Comments
Visitor (not verified)
DBGP Debugger Proxy
Sun, 2006/12/10 - 04:01There is actually a proxy implementation available with Komodo. While Komodo is a commercial product, the python debugger implementation is released under the MIT license and is available separately here.
You want the latest Python debugging package ( Komodo 4 Beta 2 ), and I blogged about how to get this set up for PHP debugging here.
Ping me if you have questions - althought he instructions deal mainly with Komodo, the editor-side configuration is pretty simple.
Khalid
I am aware of it
Sun, 2006/12/10 - 09:30Hello Jeff
Thanks for your comment.
I am aware of the xdebug proxy, and have it configured on my development server from when I was evaluating Komodo 3.5 a few months ago. I even wrote a shell wrapper around it, and created an /etc/init.d script for it to automatically start.
At the time remote debugging did not work as it should. The main problem is the mapping of local and remote files, and hence setting a breakpoint in a file does not cause Komodo to stop there.
A few weeks ago, I read on the mailing list archive that remote debugging is now working and is in the source tree. So, I downloaded the Komodo 4.0 beta, and gave it a try. I still could not get it to work. I could have spend more time on it, but time is a rare commodity these days for me.
For vim, it works perfectly since they are both on the same machine, and I do most of my editing in vim anyways.
The issue with the proxy not working with vim has to do with the debugger.py script itself. I tried changing the port to 9001 in the .vim and several places in the .py file, but it does not work. If the proxy is active, vim will close the connection as soon as the browser starts a debugging session.
If someone is using vim with xdebug and can look at that, let me know, and I will amend the article above and publish the changes.
--
2bits -- Drupal and Backdrop CMS consulting
Visitor (not verified)
Uri Mapping in 4.0
Sun, 2006/12/10 - 16:07Komodo 4.0 has a new feature called 'Mapped Uris' that allows you to map a url with a local or remote directory. This is what was described on the Beta list, but it only works once you set up these mappings in 'Preferences / Mapped URIs'. Once you have that set up Komodo is then able to map breakpoints set in a file open in the editor with the file being used by the debugger engine via Apache.
In Komodo 3.5 there was a setting in 'Preferences / Debugging' called 'Try to find files on the local filesystem when remote debugging' - this should work in cases where you are running Apache localhost.
As for the Vim implementation, if you can get ahold of the developer or are interested in fixing the proxy issues yourself let me know and I can get you in contact with Shane Caraveo and/or Derick Rethans, the authors of the DBGP protocol.
Khalid
Tried it
Sun, 2006/12/10 - 17:29I tried that, before, but it did not work.
Just to confirm, I downloaded the latest Komodo beta and gave it a try again.
For remote files, I used what is in the window title, for example:
Remote URI : file:///home/blah/drupal
Local path : /home/blah/drupal
So, I set this in Komodo, and use XDEBUG_SESSION_START, Komodo breaks at the beginning of index.php. I then open feature.module, which I know where the current page load will go, and set a break point.
I know that the mapping works, because now I don't get a lock (read only file from the server), but the same file I opened. I see the break point set, but Komodo just whizzes over it and does not stop.
What is even more puzzling is that the breakpoints are ignored even in the index.php. If I set a breakpoint a few lines after the start, Komodo does not break at that point either.
It makes no difference whether I set this mapping in the global (Preferences) or in the project itself.
--
2bits -- Drupal and Backdrop CMS consulting
Visitor (not verified)
use an http url
Mon, 2006/12/11 - 11:33For the 'Remote URI' field, you should use the HTTP address. So for example, if my Apache docroot is /var/www, I would do this:
Remote URI: http://localhost
Local Path: /var/www
Khalid
Nope
Tue, 2006/12/12 - 20:10No go.
This one makes the lock icon to come back (meaning that the file is not successfully mapped).
I had better luck mapping it as in the previous reply.
Quanta Plus (KDE's web development IDE) maps it correctly, but also does not support a proxy.
Not sure what else to try.
If you are interested to pursue this further, email me at kb at this site.
--
2bits -- Drupal and Backdrop CMS consulting
Visitor (not verified)
Still an Issue
Tue, 2008/10/21 - 15:11Has anyone figured out this issue here?
(, , )
File "/Applications/MacVim.app/Contents/Resources/vim/runtime/plugin/debugger.py", line 1078, in debugger_run
debugger.run()
File "/Applications/MacVim.app/Contents/Resources/vim/runtime/plugin/debugger.py", line 928, in run
self.protocol.accept()
File "/Applications/MacVim.app/Contents/Resources/vim/runtime/plugin/debugger.py", line 560, in accept
self.stop()
I noticed a few people here who are having that issue. Any help is much appreciated!!
Visitor (not verified)
Re: Still an Issue
Tue, 2008/10/21 - 17:45I hope this helps someone out there ... I figured out the issue. This was probably pretty obvious to everyone else, but in case there is a lonely googler out there like me searching for this answer here it is. Apparently that error is generated when the connection to the remote session has failed (it's not very descriptive, obviously).
Paul
Visitor (not verified)
Thanks
Fri, 2006/12/29 - 00:26Just wanted to say thanks for writing this extremely helpful article.
I'm using gvim + xdebug on my Mac with MAMP.
Khalid
Andrei Zmievski: VIM for PHP Programmers
Sun, 2007/03/04 - 20:39Andrei Zmievski is a technical Yahoo at Yahoo, Inc.
In his talk VIM for PHP Programmers given in Vancouver's PHP conference, February 2007, he links to this article about using xdebug DBGp to debug PHP applications.
He also repackages the debugging scripts in his vim configuration files.
--
2bits -- Drupal and Backdrop CMS consulting
Pages