Update 2017-April-20: The information in this article contains a now outdated extension for VIM. In order to use a more current extension, please get vdebug, which works with XDebug.
Original article follows ...
The power and simplicity of some tools is often overlooked or underestimated.
One such tool is good old vim (VI iMproved), a text editor for UNIX systems, also available for other platforms.
This articles describes how vim can be used with the xdebug protocol to provide full debugging capabilities for Drupal (or any PHP application for that matter).
Please note that other IDE's for PHP handle debugging, such as Komodo, and even Quanta Plus for KDE (Linux). However, to have this power from a text interface is very cool to say the least.
Credits
The xdebug interface for vim was written by Seung Woo Shin and is available on vim.org. A slightly modified version with a README file is attached to this article.
Requirements
To use this script, you have to get python 2.3 or higher, and xdebug 2.0 on your system (we will cover the installation an configuration of xdebug in a future article).
Installation
Extract the debugger.py and debugger.vim files and place them in your .vim/plugin directory (create it if it does not exist).
Starting the debugger
Start vim, and hit F5. A message will appear waiting for a debug session to start and attach to your vim instance.Now, browse to the URL of the page causing you grief, and add XDEBUG_SESSION_START to the end of the URL.
For clean URLs use: http://example.com/admin/feature?XDEBUG_SESSION_START=1 Otherwise use: http://example.com?q=admin/feature&XDEBUG_SESSION_START=1
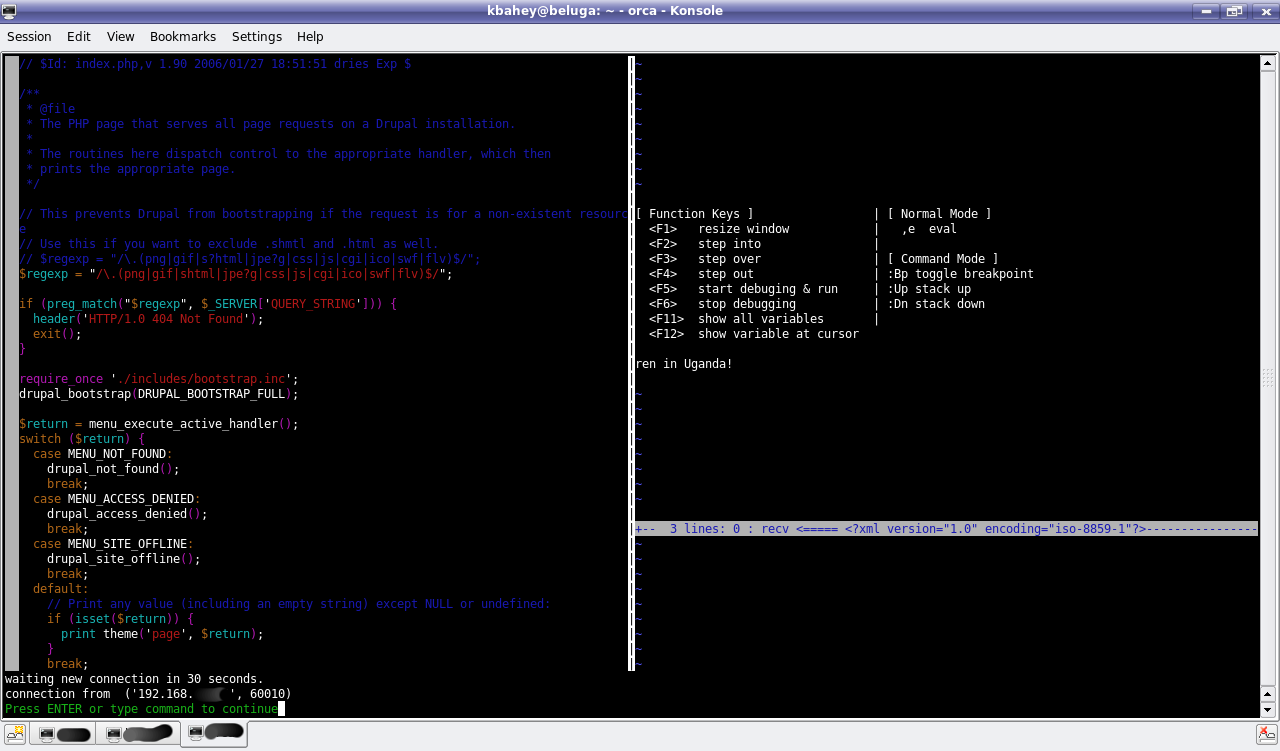
The debugger will start and several windows will appear in vim, with Drupal's index.php showing.
Here is how the start of a debug session looks:
Setting breakpoints
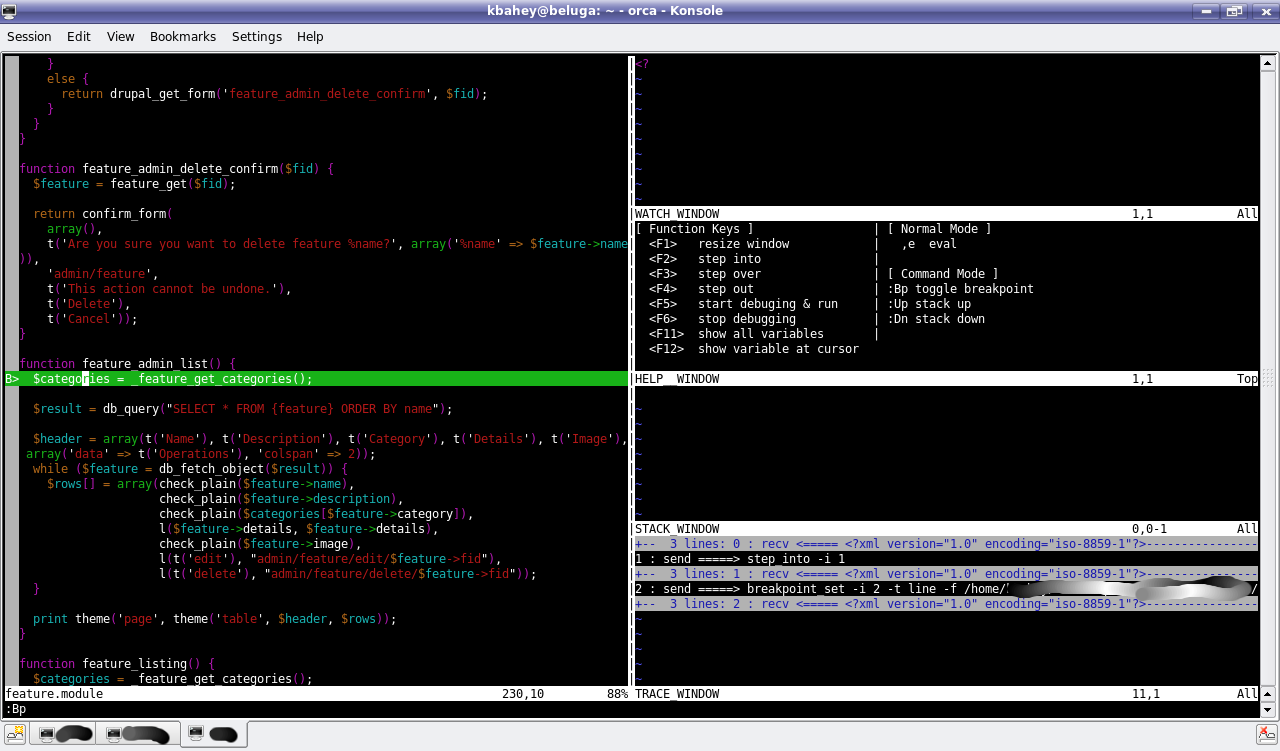
Using the :e command in vim, open the file you are interested in (e.g. feature.module in this case).Go to the function/line you suspect, and set a breakpoint using the :Bp command.
Here is how setting a breakpoint looks like:
Debugging at a breakpoint
Hit F4 to continue until the breakpoint is reached.
Reaching a breakpoints:
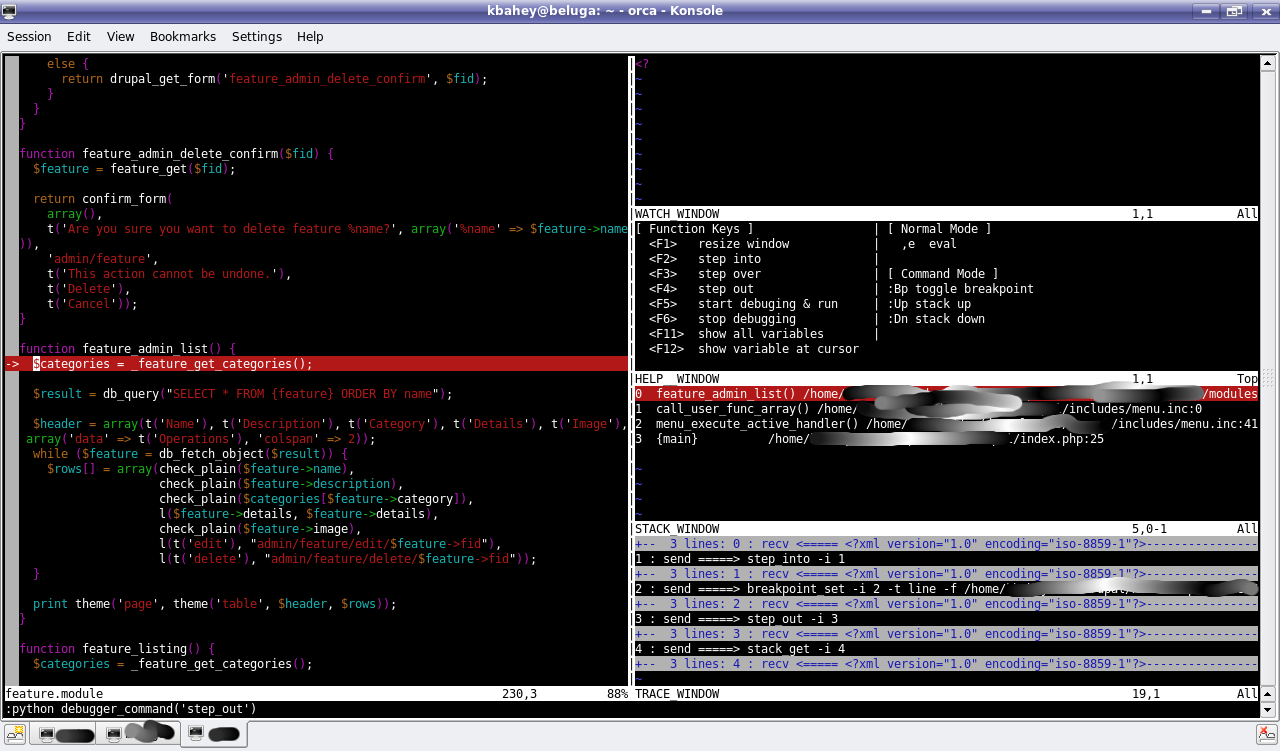
Once at the breakpoint, you can step through the program, display variables, ...etc.
Use the function keys and commands on screen.
Displaying variables
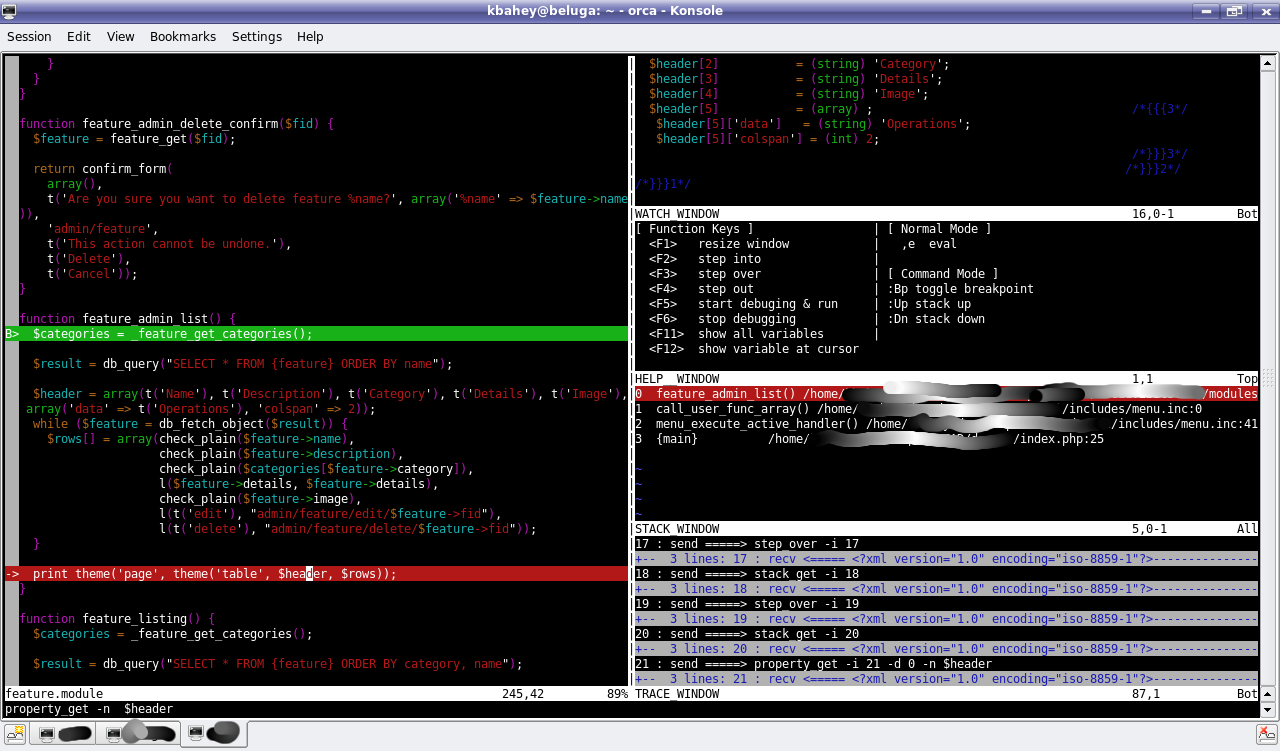
You can move the cursor to any variable, and hit F12 to see what is in this variable.
Displaying a variable:
Evaluating an expression or variable
Use the ,e command to evaluate an expression or print a variable. This is handy in complex variables such as objects and arrays.
Evaluating a variable:
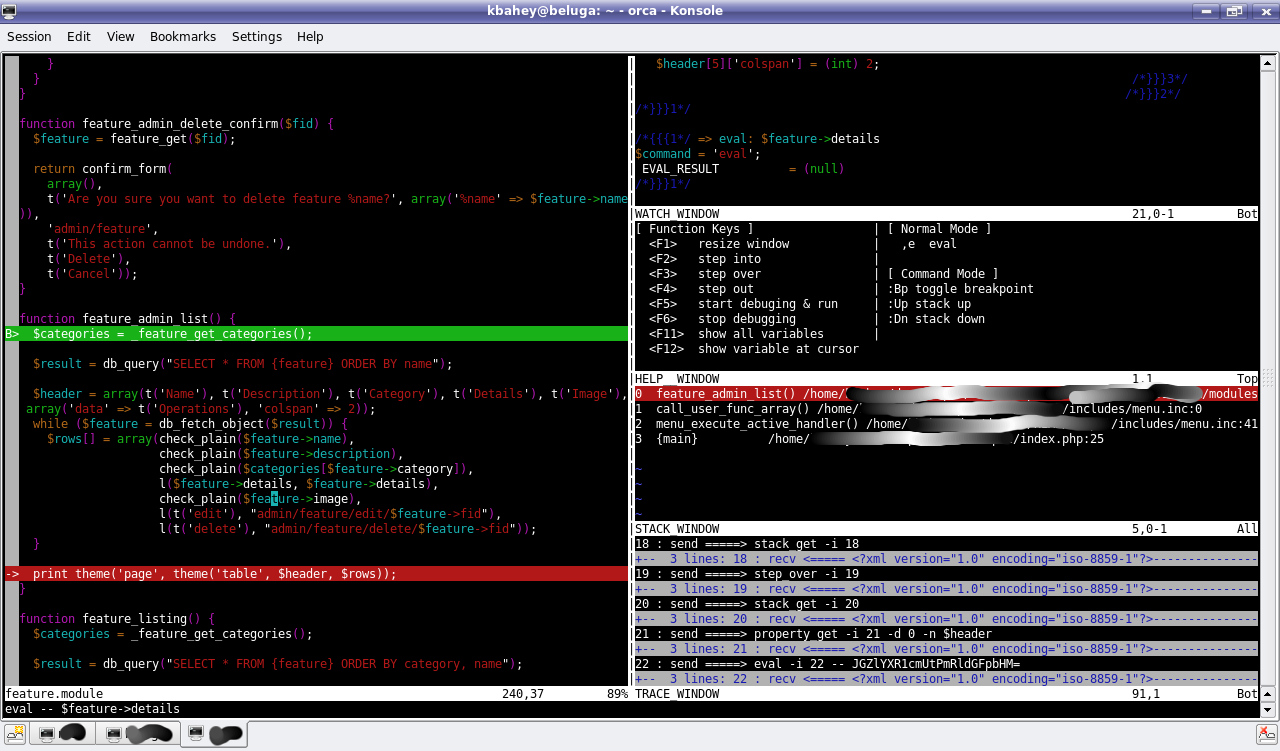
Of course, there are many more uses for this, such as seeing how Drupal handles things, and how elegant its internal architecture is.
Desired functionality
vim xdebug is very powerful yet simple. It is missing only one feature, which is multi-user support. This requires the xdebug proxy to be supported. This allows multiple sessions to connect to the proxy with a different IDE Key (the argument for XDEBUG_SESSION_START).
If someone adds that feature before I do, let me know. I have the setup to test this if needed.
| Attachment | Size |
|---|---|
| 10.77 KB |


Comments
Visitor (not verified)
luck with vim7?
Fri, 2007/03/23 - 02:21just thought i'd make a note here that this xdebug script seems to be generally incompatible with vim7. when i rolled back to vim6.4, i got it working generally well and it's been really useful. unfortunately, i don't know anything about the vim scripting language to figure how to update the script for the new vim version.
Visitor (not verified)
Not true
Fri, 2007/03/23 - 10:41I am using vim 7.0.35, and it works fine for me (Ubuntu Edgy if anyone cares).
--
2bits -- Drupal and Backdrop CMS consulting
Visitor (not verified)
still trouble here
Sat, 2007/04/07 - 21:00here on gentoo (and when i was on windows) i was having a heck of a time getting it to work, especially with vim7.
right now, i'm getting "error code=5 : Command not available" errors thrown at me. anyone know why that is?
Visitor (not verified)
figured it out
Wed, 2007/04/11 - 01:41finally figured out why i kept seeing this error! i was trying to run the debugger when my breakpoints were in code that was not being called. therefore, it couldn't find anywhere to stop when hitting and yelled with this error.
posting to help anyone who, like me, was confused by this for a while.
Visitor (not verified)
tnx - it helped me :)
Sat, 2007/04/14 - 11:56tnx - it helped me :)
Visitor (not verified)
Hello, My configuration
Sat, 2007/04/21 - 09:05Hello,
My configuration is:
- Apache/2.0.59 (Win32) PHP/5.2.0 mod_python/3.2.10 Python/2.4.3
- Xdebug: php_xdebug-2.0.0rc3-5.2.1.dll
- Vim7 (gvim)
- WinXP Pro, SP2
I've setup xdebug as confirmed by phpinfo() - I've also commented-out all Zend Optimizer stuff in php.ini.
I'm successfully getting a connection to the debugger client (debugclient-0.9.0) from xdebug. from within gvim and browse a web-page I get this error in vim:
However, when I hit
E499: Empty file name for '%' or '#', only works with ":p:h": silent edit /D%3A%5Cwamp%5Cwww%5Cprojectname%5Cindex.php
File "
File "C:\Documents and settings\Nasko/vim_local/vimfiles/plugin/debugger.py", line 983, in debugger_run
debugger.ui.tracewin.write(sys.ex.info())
File "C:\Documents and settings\Nasko/vim_local/vimfiles/plugin/debugger.py", line 137, in write
self.buffer.append(str(msg).split('\n'))
vim.error
I've googled for this error message unsuccessfully and I've no idea what to try further.
Perhaps it is related to the strange directory delimiters in the file-path?!
I'll be thankful for any hints on this one.
Cheers,
Nasko
Visitor (not verified)
Empty file name error fix
Thu, 2007/06/14 - 14:58The problem is that the filename is coming across the wire with special characters replaced by the '%xx' notation. The solution is to add the following snippet to the bottom of 'debugger.py':
import urllib

import os

def fixFileName(fileName):

    fileName = urllib.unquote(fileName)

    if os.name=='nt' and fileName[0]=="/":

        fileName = fileName[1:] # strip off initial slash char

    return fileName
then filter the file name in handle_init around line 735 like this:
    file = res.firstChild.getAttribute('fileuri')[7:]

    file = fixFileName(file)

    self.ui.set_srcview(file, 1)
I'm still working through this so there may exist other file names that need to be fixed up as well.
Visitor (not verified)
another file name to be cleaned up
Thu, 2007/06/14 - 15:14also add a call to fixFileName to handle_response_stack_get around line 769:
      for s in stacks:

        self.stacks.append( {'file':  fixFileName(s.getAttribute('filename')[7:]), \

                             'line':  int(s.getAttribute('lineno')),  \
Visitor (not verified)
This last change was enough
Fri, 2007/06/15 - 10:02This last change was enough to get it to run. I had some problems stepping over 'required' files in the php source, but stepping into those files seemed to not cause the error. Anyway, it was enough to do the debugging I needed.
Thanks for a great article.
Visitor (not verified)
Extra whitespace fix
Mon, 2007/07/09 - 07:10I've applied your changes also, but though they allow for special characters, they still don't support spaces in filenames.
I've put up a fix here: http://katherina.student.utwente.nl/~matthijs/cgi-bin/blosxom/software/PHP/XDebug.html
Pages