Update 2017-April-20: The information in this article contains a now outdated extension for VIM. In order to use a more current extension, please get vdebug, which works with XDebug.
Original article follows ...
The power and simplicity of some tools is often overlooked or underestimated.
One such tool is good old vim (VI iMproved), a text editor for UNIX systems, also available for other platforms.
This articles describes how vim can be used with the xdebug protocol to provide full debugging capabilities for Drupal (or any PHP application for that matter).
Please note that other IDE's for PHP handle debugging, such as Komodo, and even Quanta Plus for KDE (Linux). However, to have this power from a text interface is very cool to say the least.
Credits
The xdebug interface for vim was written by Seung Woo Shin and is available on vim.org. A slightly modified version with a README file is attached to this article.
Requirements
To use this script, you have to get python 2.3 or higher, and xdebug 2.0 on your system (we will cover the installation an configuration of xdebug in a future article).
Installation
Extract the debugger.py and debugger.vim files and place them in your .vim/plugin directory (create it if it does not exist).
Starting the debugger
Start vim, and hit F5. A message will appear waiting for a debug session to start and attach to your vim instance.Now, browse to the URL of the page causing you grief, and add XDEBUG_SESSION_START to the end of the URL.
For clean URLs use: http://example.com/admin/feature?XDEBUG_SESSION_START=1 Otherwise use: http://example.com?q=admin/feature&XDEBUG_SESSION_START=1
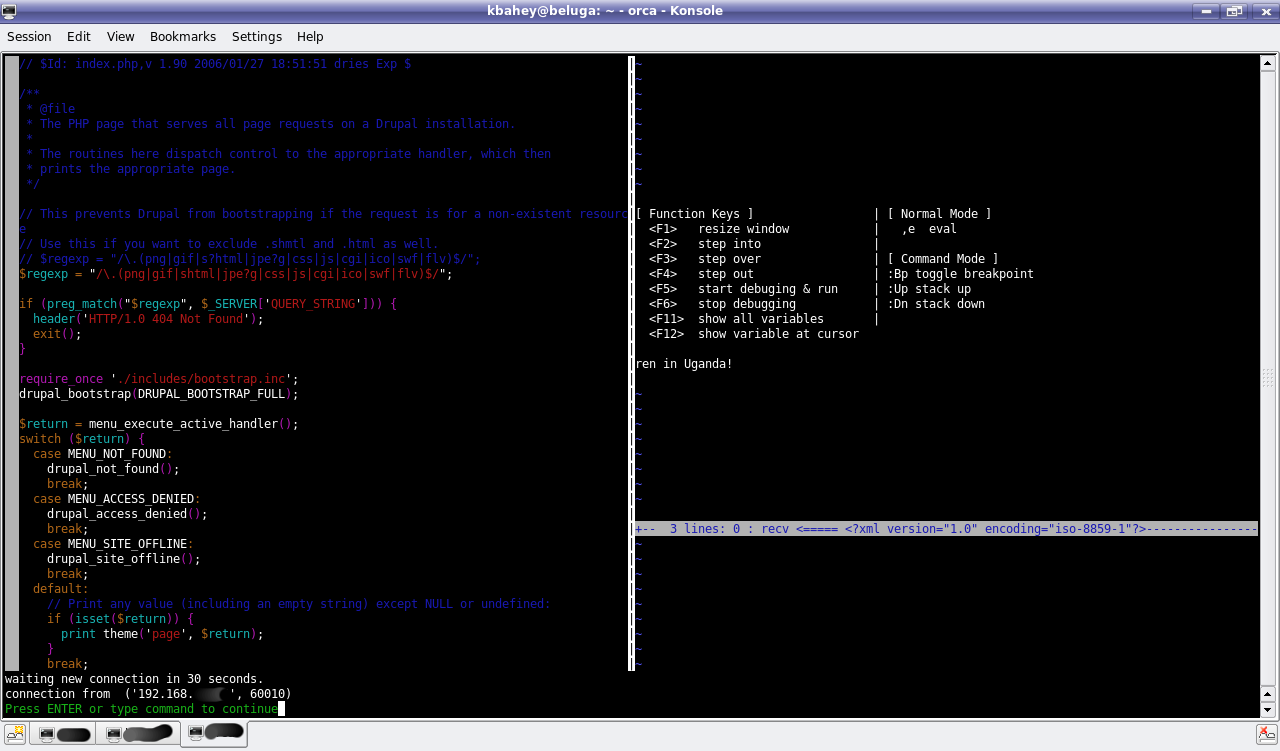
The debugger will start and several windows will appear in vim, with Drupal's index.php showing.
Here is how the start of a debug session looks:
Setting breakpoints
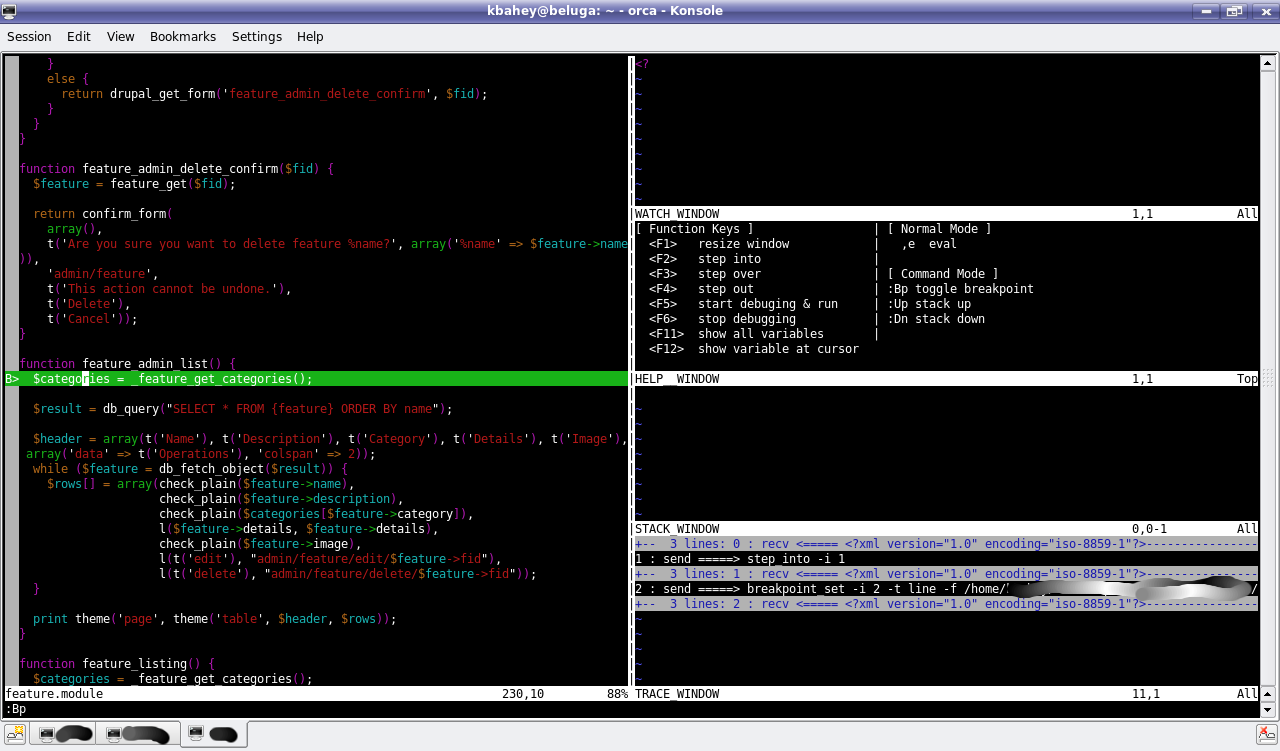
Using the :e command in vim, open the file you are interested in (e.g. feature.module in this case).Go to the function/line you suspect, and set a breakpoint using the :Bp command.
Here is how setting a breakpoint looks like:
Debugging at a breakpoint
Hit F4 to continue until the breakpoint is reached.
Reaching a breakpoints:
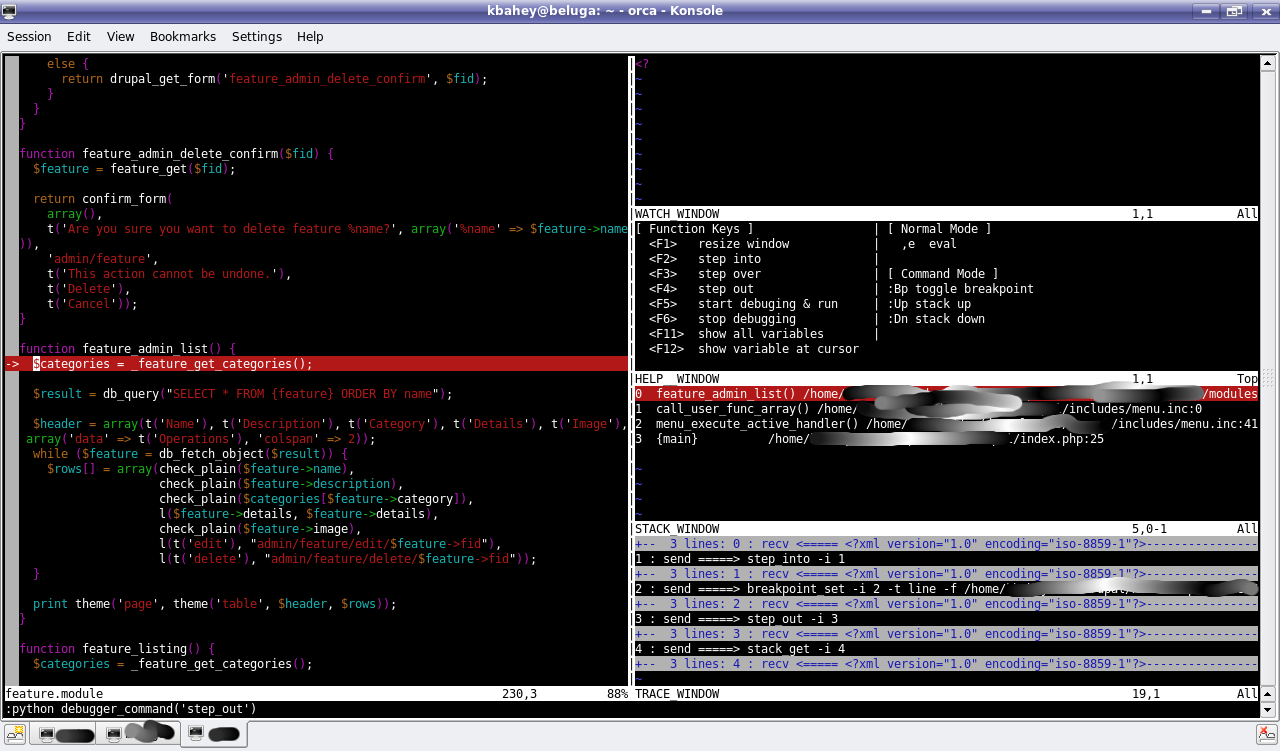
Once at the breakpoint, you can step through the program, display variables, ...etc.
Use the function keys and commands on screen.
Displaying variables
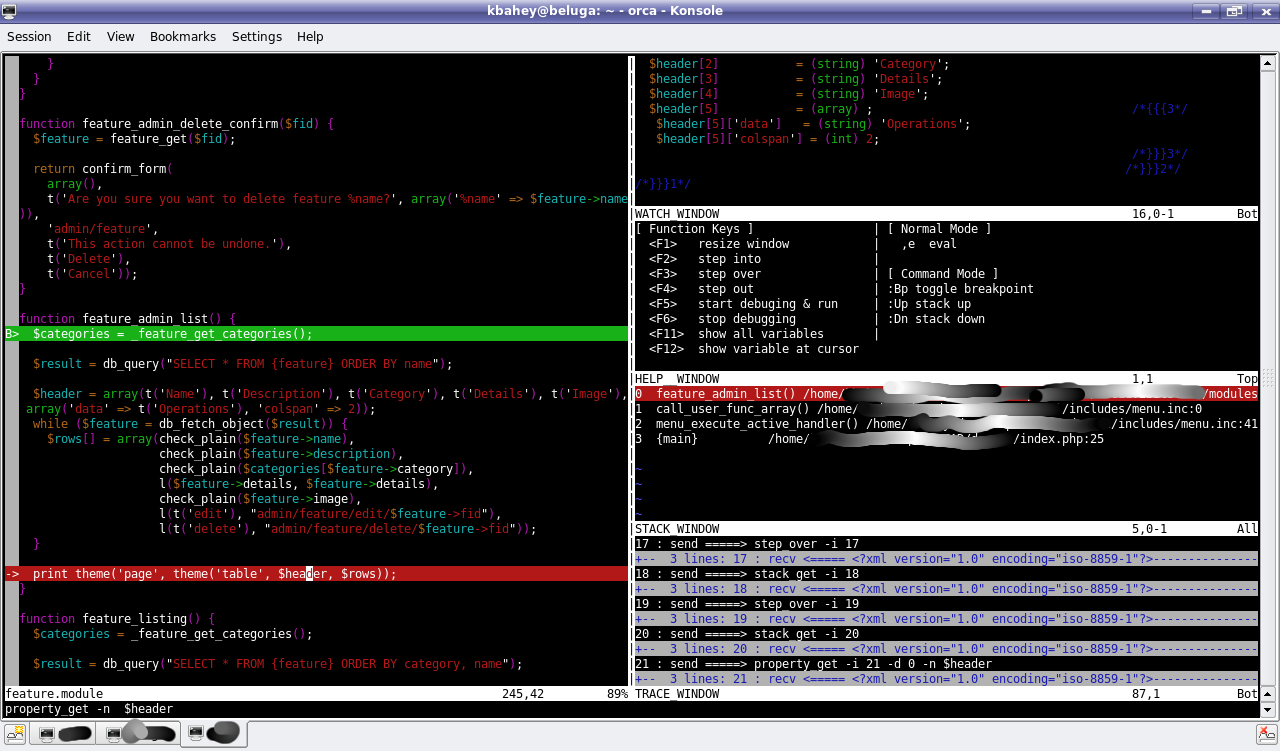
You can move the cursor to any variable, and hit F12 to see what is in this variable.
Displaying a variable:
Evaluating an expression or variable
Use the ,e command to evaluate an expression or print a variable. This is handy in complex variables such as objects and arrays.
Evaluating a variable:
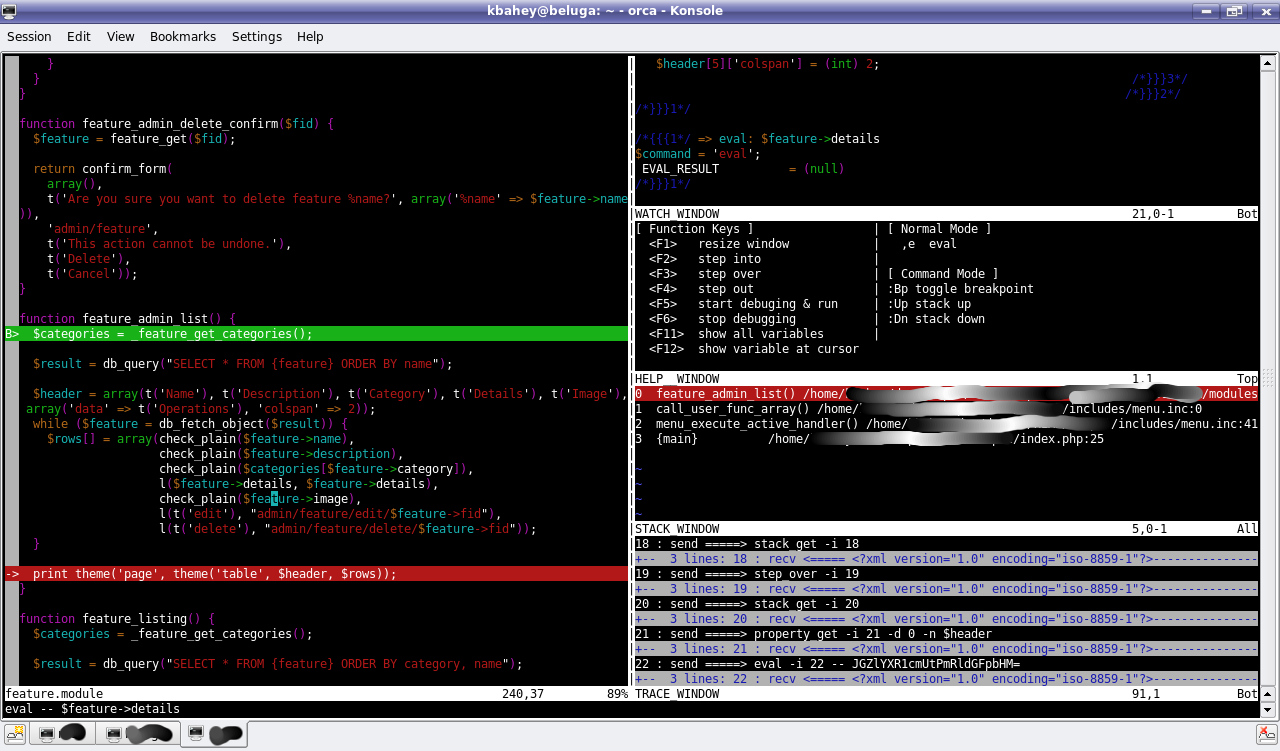
Of course, there are many more uses for this, such as seeing how Drupal handles things, and how elegant its internal architecture is.
Desired functionality
vim xdebug is very powerful yet simple. It is missing only one feature, which is multi-user support. This requires the xdebug proxy to be supported. This allows multiple sessions to connect to the proxy with a different IDE Key (the argument for XDEBUG_SESSION_START).
If someone adds that feature before I do, let me know. I have the setup to test this if needed.
| Attachment | Size |
|---|---|
| 10.77 KB |


Comments
Vacilando (not verified)
F5?
Mon, 2010/11/01 - 04:08I wanted to try debugging using an EC2 instance, so I downloaded the files and went to see the script in vim using vim .vim/plugin/debugger.vim. But when I hit F5, nothing happened. Does this mean that the above does not apply to running vim in a SSH terminal. If that's the case, what else would you advise for interactive debugging via SSH terminal, please?
Khalid
Works on SSH
Mon, 2010/11/01 - 10:34Works for me in SSH. I did nothing special to make it so. But I am on Linux (KDE Ubuntu to be specific). Maybe it is putty or whatever you are using for terminal that does not send the right sequence?
Vacilando (not verified)
Thanks a lot for your
Mon, 2010/11/01 - 11:32Thanks a lot for your reaction. Yes, I am putty under Vista 64. That must be the reason. Any other method you could advise for debugging in such situation (dev server on the cloud)?
Visitor (not verified)
variable content is not shown upon pressing F12
Mon, 2011/03/28 - 23:59If you will have time, please take a look at
http://stackoverflow.com/questions/5467673/xdebug-vim-plugin-doesnt-show-variable-values-php
i've described there everything i did
in short: variable content is not shown upon pressing F12
Francis Pilon (not verified)
Getting more depth out of eval
Tue, 2012/04/03 - 14:54If you are slightly unimpressed with the 'depth' of the results you get from eval, add/modify this line to your ~/.vim/plugin/debugger.vim:
You may have to play with this value to make it work for you.
Kelvin Lee (not verified)
POST Method
Wed, 2012/05/16 - 00:44Great article! I got my Xdebug and Vim working in 5 mins thanks you it :)
I'm wondering, is there anyway to debug callback function that is called by Form API? I tried setting breakpoint in the callback function, but seems like Xdebug lost the connection to the debug session whenever I click on the submit button. Is there anyway to do that using Vim? Or do I really need to use Eclipse or Netbean to do the job?
Hope this thread is not too old just yet :P
tirengarfio (not verified)
Hi, I'm new to debugging
Wed, 2012/11/07 - 13:56Hi,
I'm new to debugging using xdebug, so for checking the value of a variable I think these are the steps:
- Press F5 in vim
- Press F5 in browser
- Press F4 in vim
- Move the cursor to the variable
- Press F12 to check the value of the variable
It works ok, but for me these are too much steps just to avoid the typical var_dump($variable);die; line.
Is there anything am I doing wrong? is there any other quicker way to check the value of a variable?
Javi
Visitor (not verified)
Extract the debugger.py and
Wed, 2015/12/09 - 07:25Extract the debugger.py and debugger.vim files and place them in your .vim/plugin directory (create it if it does not exist).
I dint understand any bit of it. Where can I find debugger.py and debugger.vim and what is the full path of .vim directory.
Sorry I am new to this I have already installed xdebug. Please help.
oliverusselldev (not verified)
xdebug with vscode
Thu, 2019/04/25 - 08:35You can definitely use xdebug with vim for php code debugging, but I would suggest you try it out with vscode. It is easier to work with vscode+xdebug.
Check it here.
Pages