Update 2017-April-20: The information in this article contains a now outdated extension for VIM. In order to use a more current extension, please get vdebug, which works with XDebug.
Original article follows ...
The power and simplicity of some tools is often overlooked or underestimated.
One such tool is good old vim (VI iMproved), a text editor for UNIX systems, also available for other platforms.
This articles describes how vim can be used with the xdebug protocol to provide full debugging capabilities for Drupal (or any PHP application for that matter).
Please note that other IDE's for PHP handle debugging, such as Komodo, and even Quanta Plus for KDE (Linux). However, to have this power from a text interface is very cool to say the least.
Credits
The xdebug interface for vim was written by Seung Woo Shin and is available on vim.org. A slightly modified version with a README file is attached to this article.
Requirements
To use this script, you have to get python 2.3 or higher, and xdebug 2.0 on your system (we will cover the installation an configuration of xdebug in a future article).
Installation
Extract the debugger.py and debugger.vim files and place them in your .vim/plugin directory (create it if it does not exist).
Starting the debugger
Start vim, and hit F5. A message will appear waiting for a debug session to start and attach to your vim instance.Now, browse to the URL of the page causing you grief, and add XDEBUG_SESSION_START to the end of the URL.
For clean URLs use: http://example.com/admin/feature?XDEBUG_SESSION_START=1 Otherwise use: http://example.com?q=admin/feature&XDEBUG_SESSION_START=1
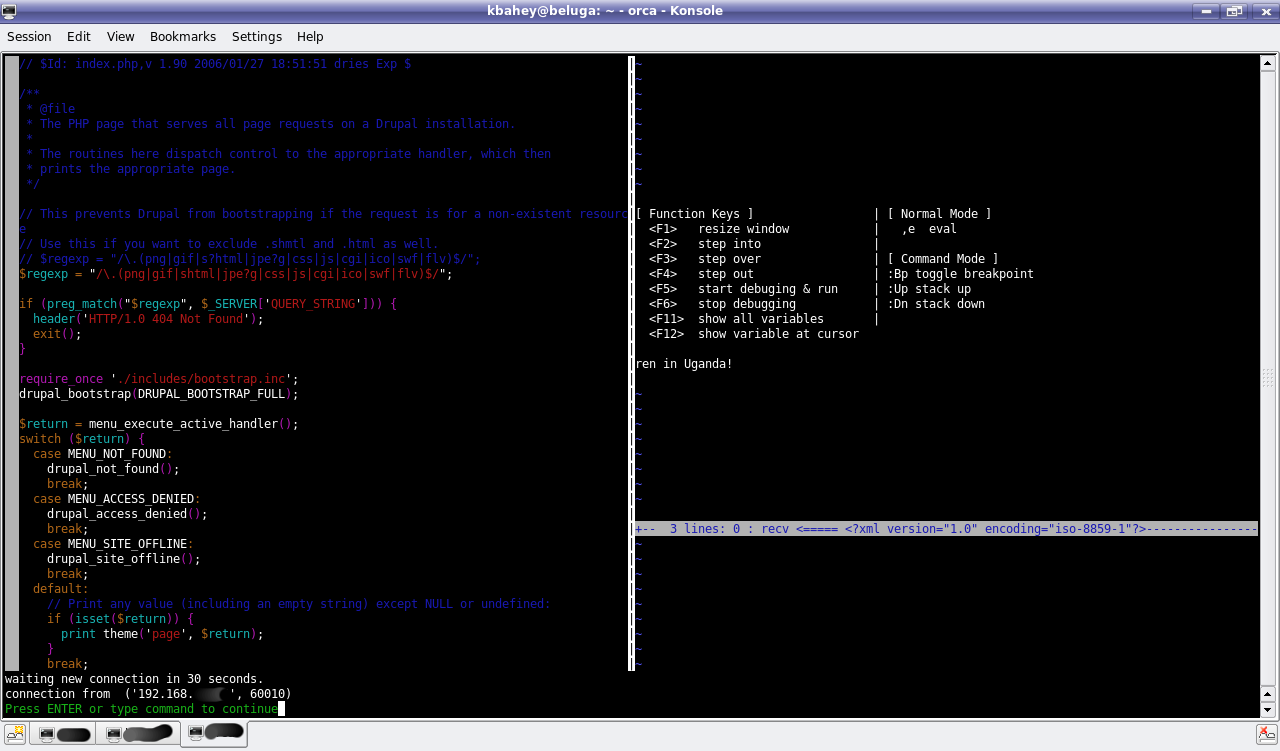
The debugger will start and several windows will appear in vim, with Drupal's index.php showing.
Here is how the start of a debug session looks:
Setting breakpoints
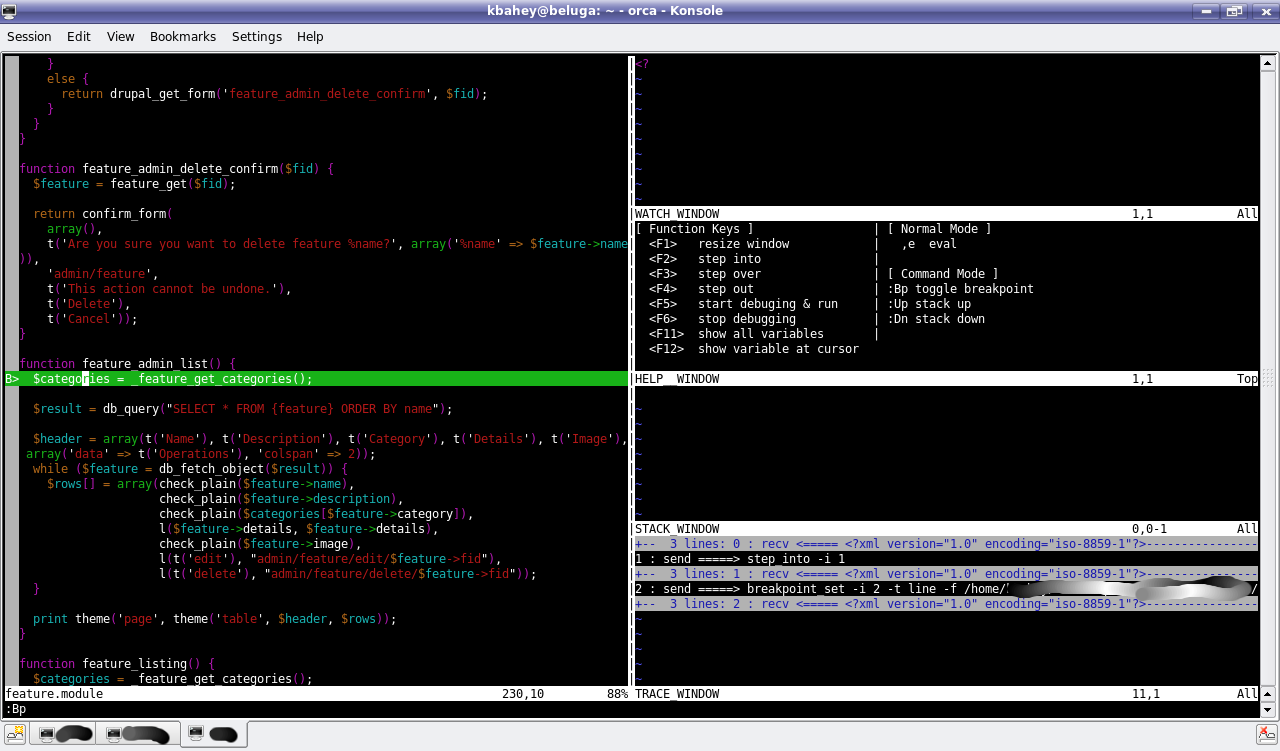
Using the :e command in vim, open the file you are interested in (e.g. feature.module in this case).Go to the function/line you suspect, and set a breakpoint using the :Bp command.
Here is how setting a breakpoint looks like:
Debugging at a breakpoint
Hit F4 to continue until the breakpoint is reached.
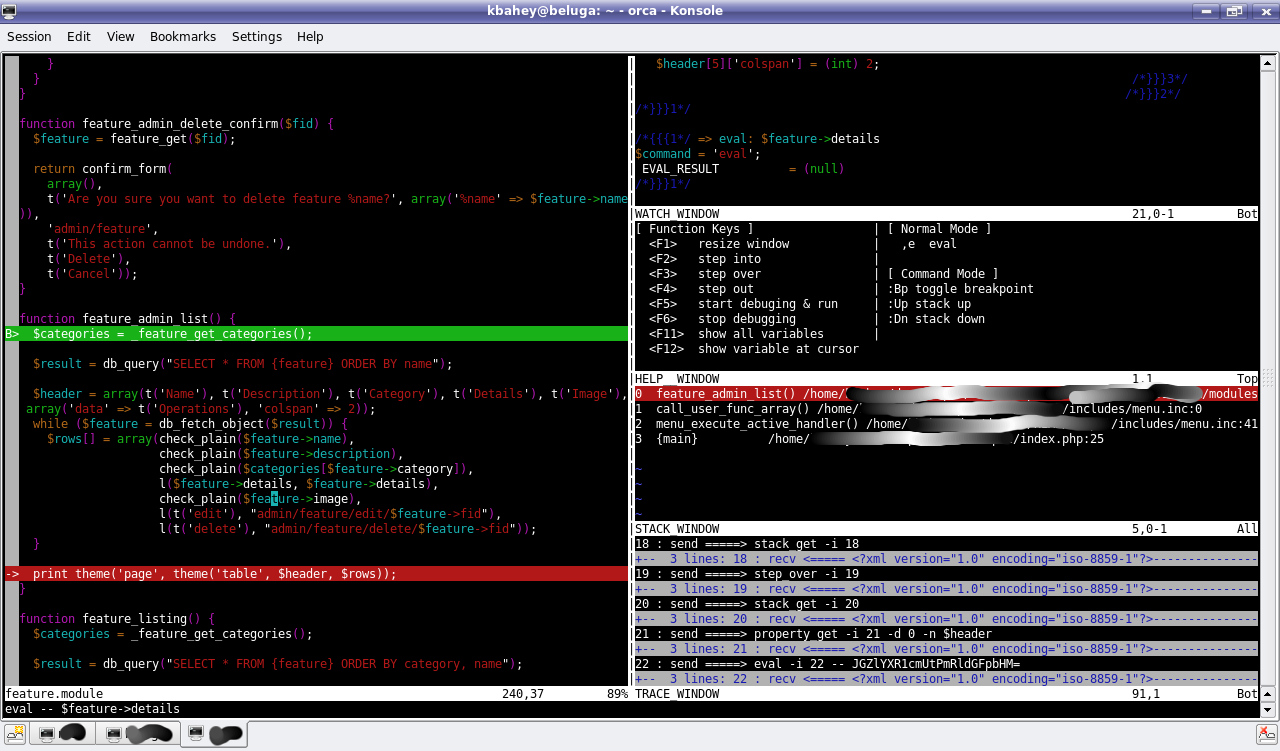
Reaching a breakpoints:
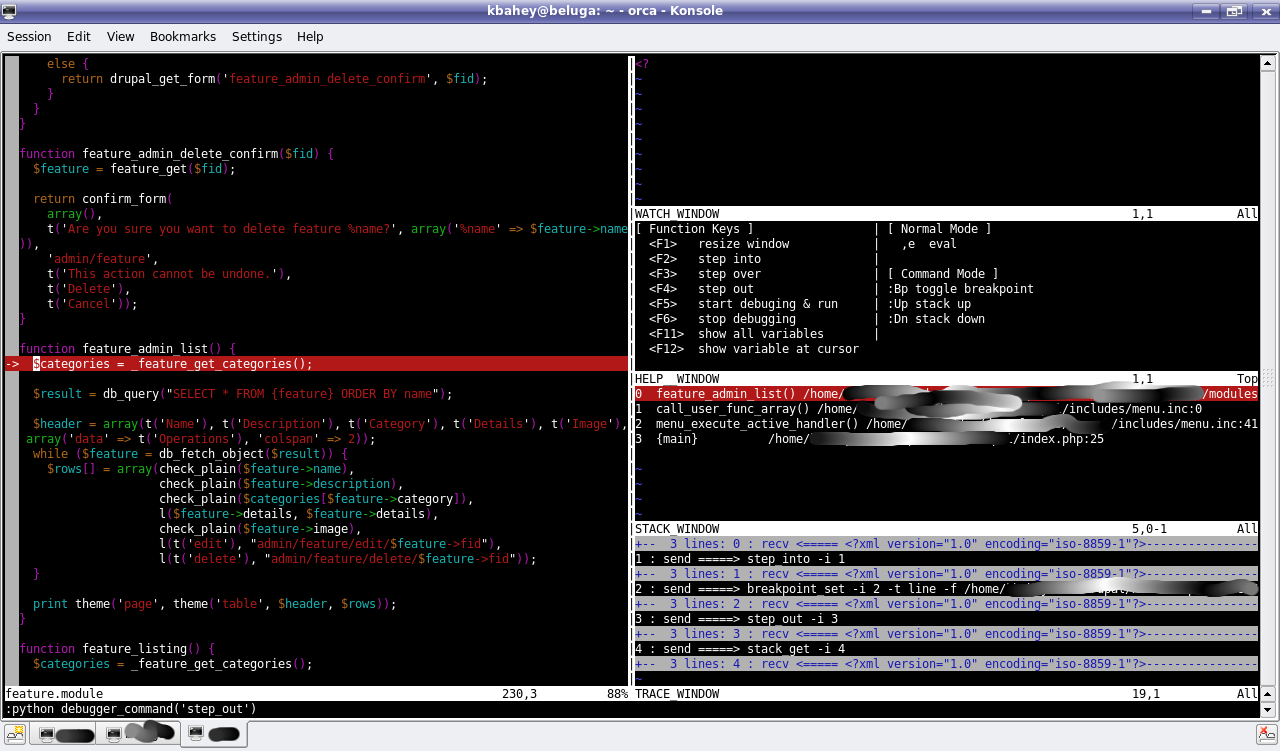
Once at the breakpoint, you can step through the program, display variables, ...etc.
Use the function keys and commands on screen.
Displaying variables
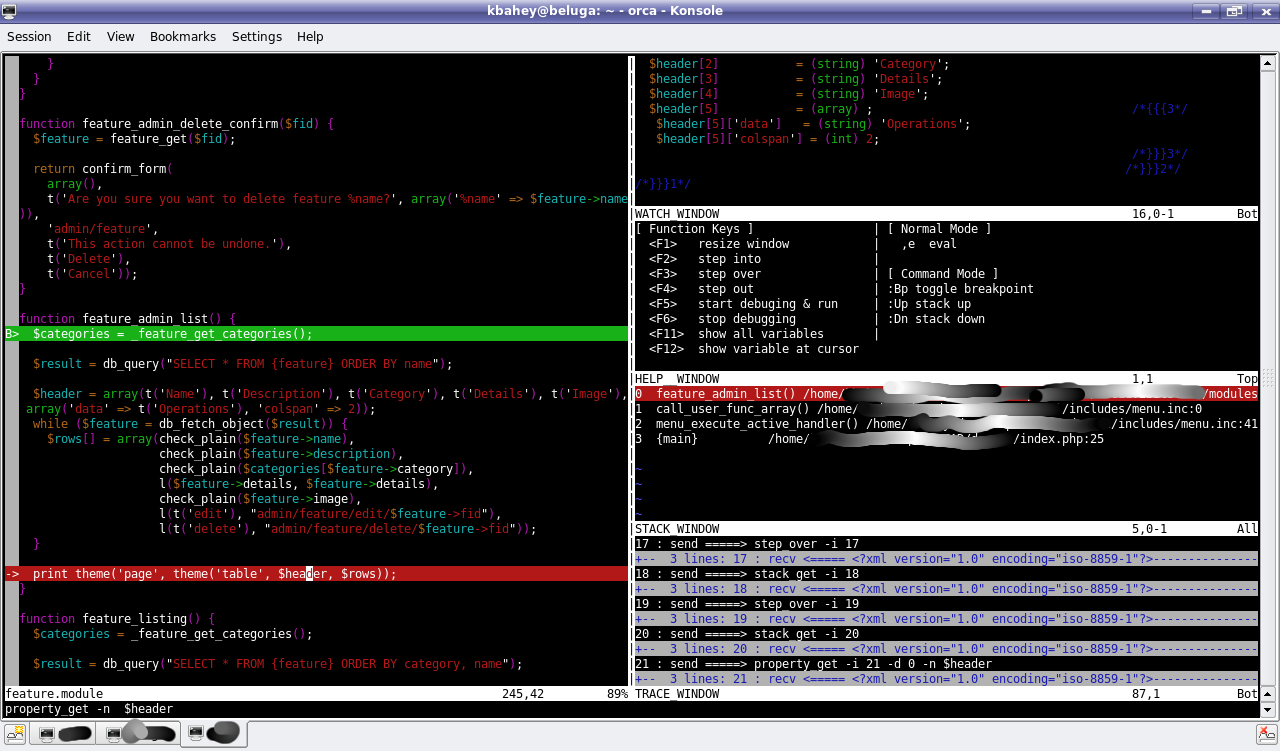
You can move the cursor to any variable, and hit F12 to see what is in this variable.
Displaying a variable:
Evaluating an expression or variable
Use the ,e command to evaluate an expression or print a variable. This is handy in complex variables such as objects and arrays.
Evaluating a variable:
Of course, there are many more uses for this, such as seeing how Drupal handles things, and how elegant its internal architecture is.
Desired functionality
vim xdebug is very powerful yet simple. It is missing only one feature, which is multi-user support. This requires the xdebug proxy to be supported. This allows multiple sessions to connect to the proxy with a different IDE Key (the argument for XDEBUG_SESSION_START).
If someone adds that feature before I do, let me know. I have the setup to test this if needed.
| Attachment | Size |
|---|---|
| 10.77 KB |


Comments
Visitor (not verified)
asking for help with installation
Sun, 2007/04/22 - 19:11I'd like to ask for some help with with installing xdebug. I've installed python and vim (although I think my server might already have had it since I have been using the vi editor?), and then I have the extracted xdebug files (debugger.py and debugger.vim) at /home/myusername/.vim/plugin/, but now what?
I've tried running vim by typing "vim" at the command line, and then hitting, but that doesn't seem to do anything? Am I missing a step here?
Visitor (not verified)
Key bindings not working
Mon, 2007/07/23 - 06:11Hey i tried running following your guide, but It's not quite working...
I'm running Debian and vim 7.0.122, xdebug is running correctly. And when i try to execute :python debugger_run() it actually starts the debugger but throws an exception if no connection is made.
This is not that big a problem.
The real issue is that all the key bindins in debugger.vim aren't binded... so starting the debugger by pressing F5 does not work and all the other bindings which is highly frustrating.
I guess the problem is really some sort of error in debugger.vim, I just don't know how do fix it :(
Hope you guys can help!
regards Simon
Visitor (not verified)
Complimentary Howto Guide
Wed, 2007/08/01 - 08:55I've written a complimentary article to this one: Easy PHP Debugging in Ubuntu (using Xdebug and Vim). I've linked to this article from mine as it was a fantastic resource (that and the setting up Xdebug article) when getting this working on my machine.
My article aims to be a bit simpler, aiming for people who know about PHP but not necessarily GNU+Linux. :)
Thanks for the fantastic articles!
Visitor (not verified)
maybe the URL is wrong
Fri, 2007/08/31 - 09:07I click the article url and get a error page. So I try to search the title inside the blog, and get the right one:
http://www.apaddedcell.com/easy-php-debugging-ubuntu-using-xdebug-and-vim
Visitor (not verified)
Fixed
Fri, 2007/08/31 - 10:01I added the URL you pointed out. Thanks.
--
2bits -- Drupal and Backdrop CMS consulting
Khalid
Another article
Sun, 2007/09/30 - 11:53An article on how to debug PHP with vim and xdebug.
--
2bits -- Drupal and Backdrop CMS consulting
Visitor (not verified)
Can't get it to work at all
Thu, 2007/11/01 - 01:57Not sure if anyone is still looking at these comment posts, but I've got a question if someone is there to help... I'm running ubuntu gutsy 7.10, vim7.1, xdebug v2.0.2-dev (installed as a zend extension using pecl), and I'm using Sam Ghoads' version of the vim debugger that he modified from Seung Woo Shin. For the life of me, no matter what I do, I always get this very unhelpful error message after hitting F5 and then refreshing the browser page to connect:
waiting for a new connection on port 9000 for 5 seconds..., AttributeError("DbgProtocol instance has no attribute 'stop'",),
)
Connection closed, stop debugging
(
File "/usr/share/vim/vim71/plugin/debugger.py", line 1078, in debugger_run
debugger.run()
File "/usr/share/vim/vim71/plugin/debugger.py", line 928, in run
self.protocol.accept()
File "/usr/share/vim/vim71/plugin/debugger.py", line 560, in accept
self.stop()
My problem is that I don't even know where to start in figuring out how to troubleshoot this... I've gone and tried re-installing xdebug in various ways, and I definitely have xdebug working because it shows up in my phpinfo() as well as it works for general profiling of php scripts. I have vim with the +python and +signs flags compiled, so I know python is working (I even tried some python from the command mode inside vim). It seems like a very simple process to set up... I've got the .vim and .py debugger files in my .vim/plugin directory so I haven't the slightest idea where to go for help on this. If anyone on here has any ideas or knows where I should go to find help, I'd be much abliged.
Visitor (not verified)
I have the exact same
Sat, 2007/11/03 - 23:04I have the exact same problem. So you are not alone.
Visitor (not verified)
I have gutsy it's working for me
Fri, 2008/03/28 - 12:29vim compiled from svn (i don't think it matters though)
zeus web server
php-cgi stock gutsy
i'm using the stock vim plugin, haven't tried his modified version.
php.ini (make sure you put this in the right php.ini as shown by phpinfo
[Zend]
# xdebug
zend_extension="/usr/lib/php5/20060613+lfs/xdebug.so"
xdebug.remote_enable = 1
xdebug.remote_port = 9000
xdebug.remote_host = localhost
Visitor (not verified)
Same problem
Tue, 2009/01/06 - 08:54I have pretty much the same config as the Gutsy example above. I tried:
http://localhost/php1.php?XDEBUG_SESSION_START=1
I get after 5 seconds:
(, AttributeError("DbgProtocol instance has no attribute 's
File "/usr/share/vim/vim71/plugin/debugger.py", line 1078, in debugger_run
debugger.run()
File "/usr/share/vim/vim71/plugin/debugger.py", line 928, in run
self.protocol.accept()
File "/usr/share/vim/vim71/plugin/debugger.py", line 560, in accept
self.stop()
Running vim, apache and xdebug from distro packages on Hardy, 8.04 Phpinfo shows Xdebug installed and functional.
Jim.
Pages